

Southern States Have The Lowest Average Incomes, DC The Highest
Personal income levels across the U.S. vary widely, shaped by differences in industries, costs of living, and economic growth.
This map lists states by their per capita personal income, showing where residents, on average, earn the most.
The data, via Visual Capitalist’s Pallavi Rao, for this visualization comes from the U.S. Bureau of Economic Analysis, compiled by StatsAmerica.
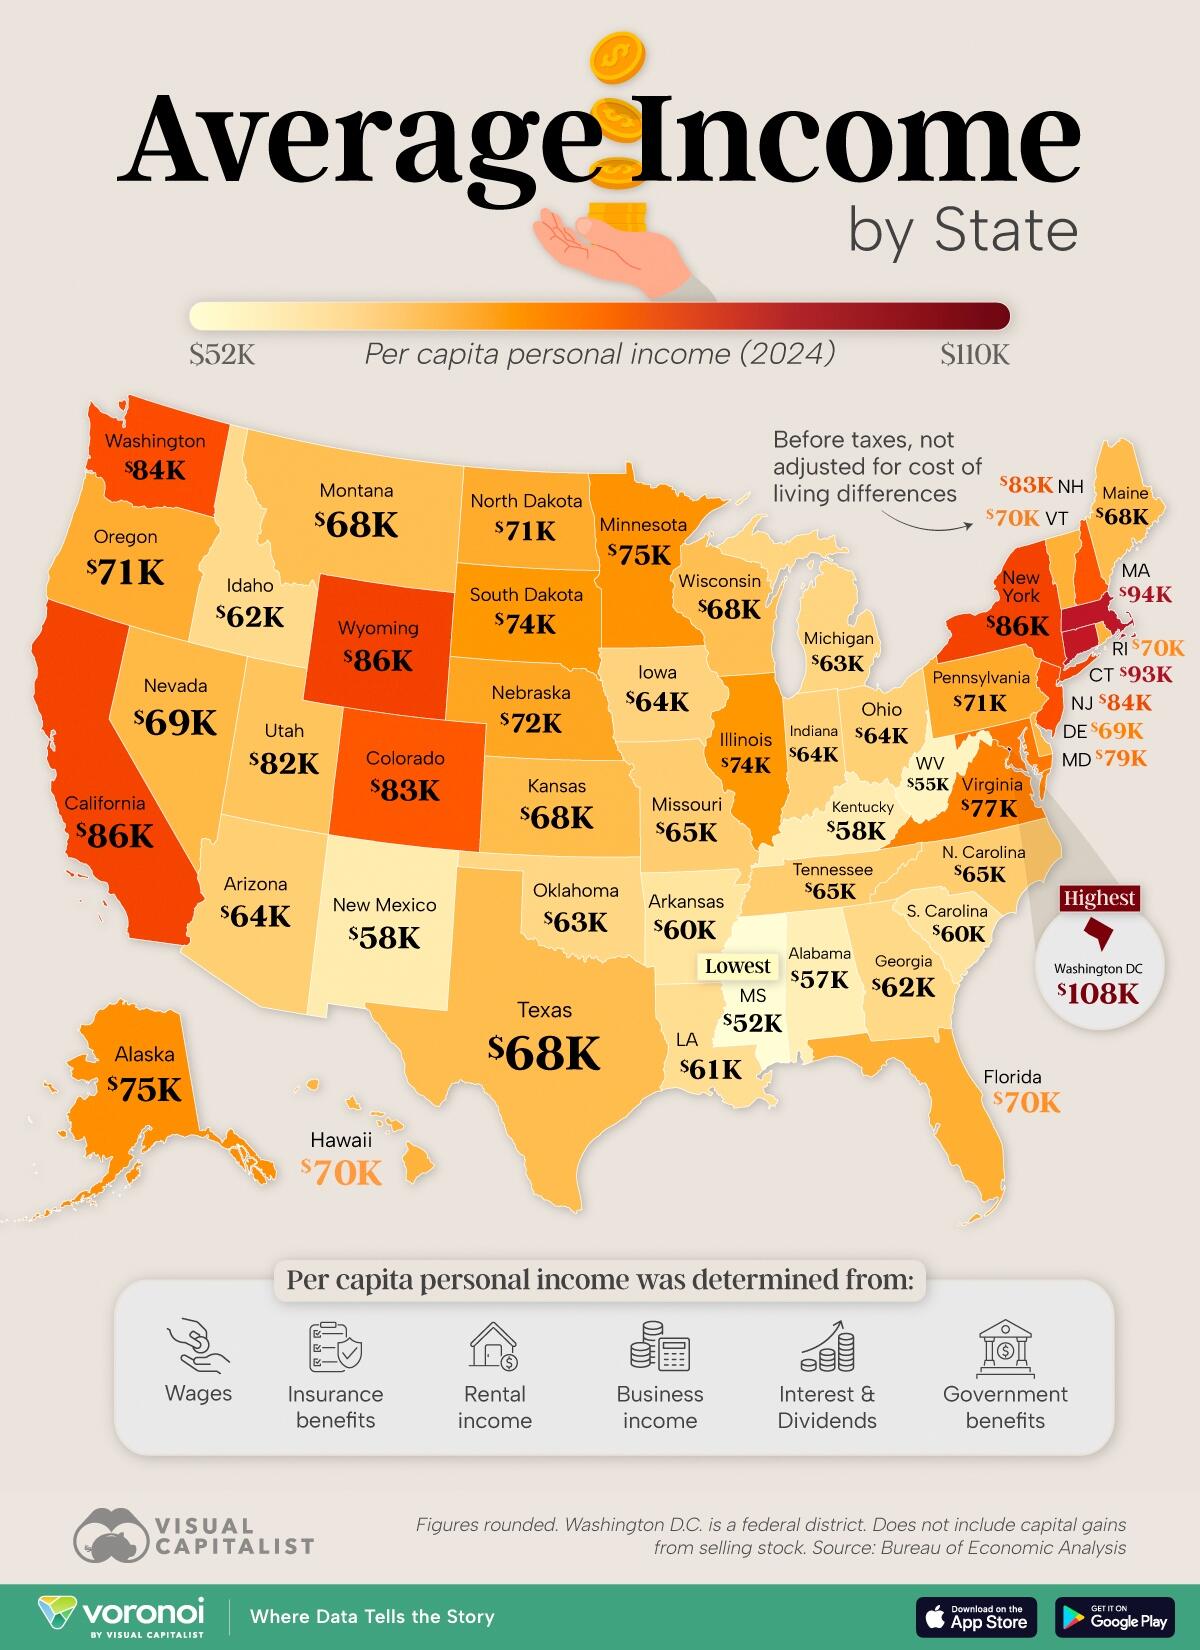
These figures include pre-tax earnings from: wages, insurance & government business & rental income, interest, and dividends, unadjusted for living costs.
It does not include capital gains from selling stock.
Ranked: U.S. States With the Highest Income in 2024
Washington, D.C. holds the highest per capita personal income in the nation at $108,233, boosted by a concentration of high-paying government, legal, and consulting jobs.
| Rank | State | Code | Per Capita Personal Income (2024) |
|---|---|---|---|
| 1 | DC | DC | $108,233 |
| 2 | Massachusetts | MA | $93,927 |
| 3 | Connecticut | CT | $93,235 |
| 4 | Wyoming | WY | $85,945 |
| 5 | New York | NY | $85,733 |
| 6 | California | CA | $85,518 |
| 7 | New Jersey | NJ | $84,071 |
| 8 | Washington | WA | $83,938 |
| 9 | New Hampshire | NH | $82,878 |
| 10 | Colorado | CO | $82,705 |
| 11 | Maryland | MD | $78,538 |
| 12 | Virginia | VA | $77,093 |
| 13 | Alaska | AK | $75,247 |
| 14 | Minnesota | MN | $74,943 |
| 15 | Illinois | IL | $74,197 |
| 16 | South Dakota | SD | $73,959 |
| 17 | Nebraska | NE | $71,859 |
| 18 | Pennsylvania | PA | $71,148 |
| 19 | North Dakota | ND | $70,966 |
| 20 | Oregon | OR | $70,685 |
| 21 | Florida | FL | $70,390 |
| 22 | Vermont | VT | $70,086 |
| 23 | Rhode Island | RI | $69,936 |
| 24 | Hawaii | HI | $69,520 |
| 25 | Delaware | DE | $69,282 |
| 26 | Nevada | NV | $68,657 |
| 27 | Maine | ME | $68,129 |
| 28 | Kansas | KS | $68,038 |
| 29 | Texas | TX | $67,942 |
| 30 | Montana | MT | $67,615 |
| 31 | Wisconsin | WI | $67,586 |
| 32 | Utah | UT | $66,443 |
| 33 | Tennessee | TN | $64,908 |
| 34 | North Carolina | NC | $64,855 |
| 35 | Missouri | MO | $64,740 |
| 36 | Arizona | AZ | $64,456 |
| 37 | Ohio | OH | $64,225 |
| 38 | Indiana | IN | $63,802 |
| 39 | Iowa | IA | $63,573 |
| 40 | Michigan | MI | $63,221 |
| 41 | Oklahoma | OK | $62,661 |
| 42 | Georgia | GA | $62,393 |
| 43 | Idaho | ID | $61,836 |
| 44 | Louisiana | LA | $61,332 |
| 45 | South Carolina | SC | $59,995 |
| 46 | Arkansas | AR | $59,663 |
| 47 | New Mexico | NM | $57,652 |
| 48 | Kentucky | KY | $57,526 |
| 49 | Alabama | AL | $56,684 |
| 50 | West Virginia | WV | $55,138 |
| 51 | Mississippi | MS | $52,017 |
Massachusetts follows at $93,927, powered by its robust education, healthcare, and tech sectors.
Connecticut, with its strong finance and insurance industries, comes in third at $93,235.
All three leaders are at nearly twice the income last-ranked Mississippi ($52,017), reflecting the impact of specialized, high-skill industries on local income levels.
Meanwhile, New York ($85,733), New Jersey ($84,071), and New Hampshire ($82,878) keep the broader Northeast near the top of the distribution.
America’s West: The Tech Juggernaut
California ($85,518) and Washington ($83,938) both place in the top 10 states by income.
Their high incomes are linked to thriving technology and innovation economies, with major employers like Apple, Microsoft, and Google anchoring the regions.
These states also attract high-skilled migrants, further boosting wage levels.
American South Incomes Still Underperform
The bottom of the ranking is dominated by Southern states, with Mississippi at $52,017 and West Virginia at $55,138.
Lower wages, coupled with economies centered on agriculture and lower-wage manufacturing, contribute to these figures.
These same states also have a higher rate of poverty, but also a lower cost of living.
If you enjoyed today’s post, check out Mapped: The Purchasing Power of $100 in Each U.S. State on Voronoi, the new app from Visual Capitalist.
Tyler Durden
Fri, 08/15/2025 – 06:55ZeroHedge News


 R1
R1
 T1
T1


