
Visualizing How America’s Workforce Has Changed Over The Past 25 Years
Two decades ago, nearly one in five American workers answered phones, filed paperwork, or managed calendars.
Today, that figure has fallen sharply.
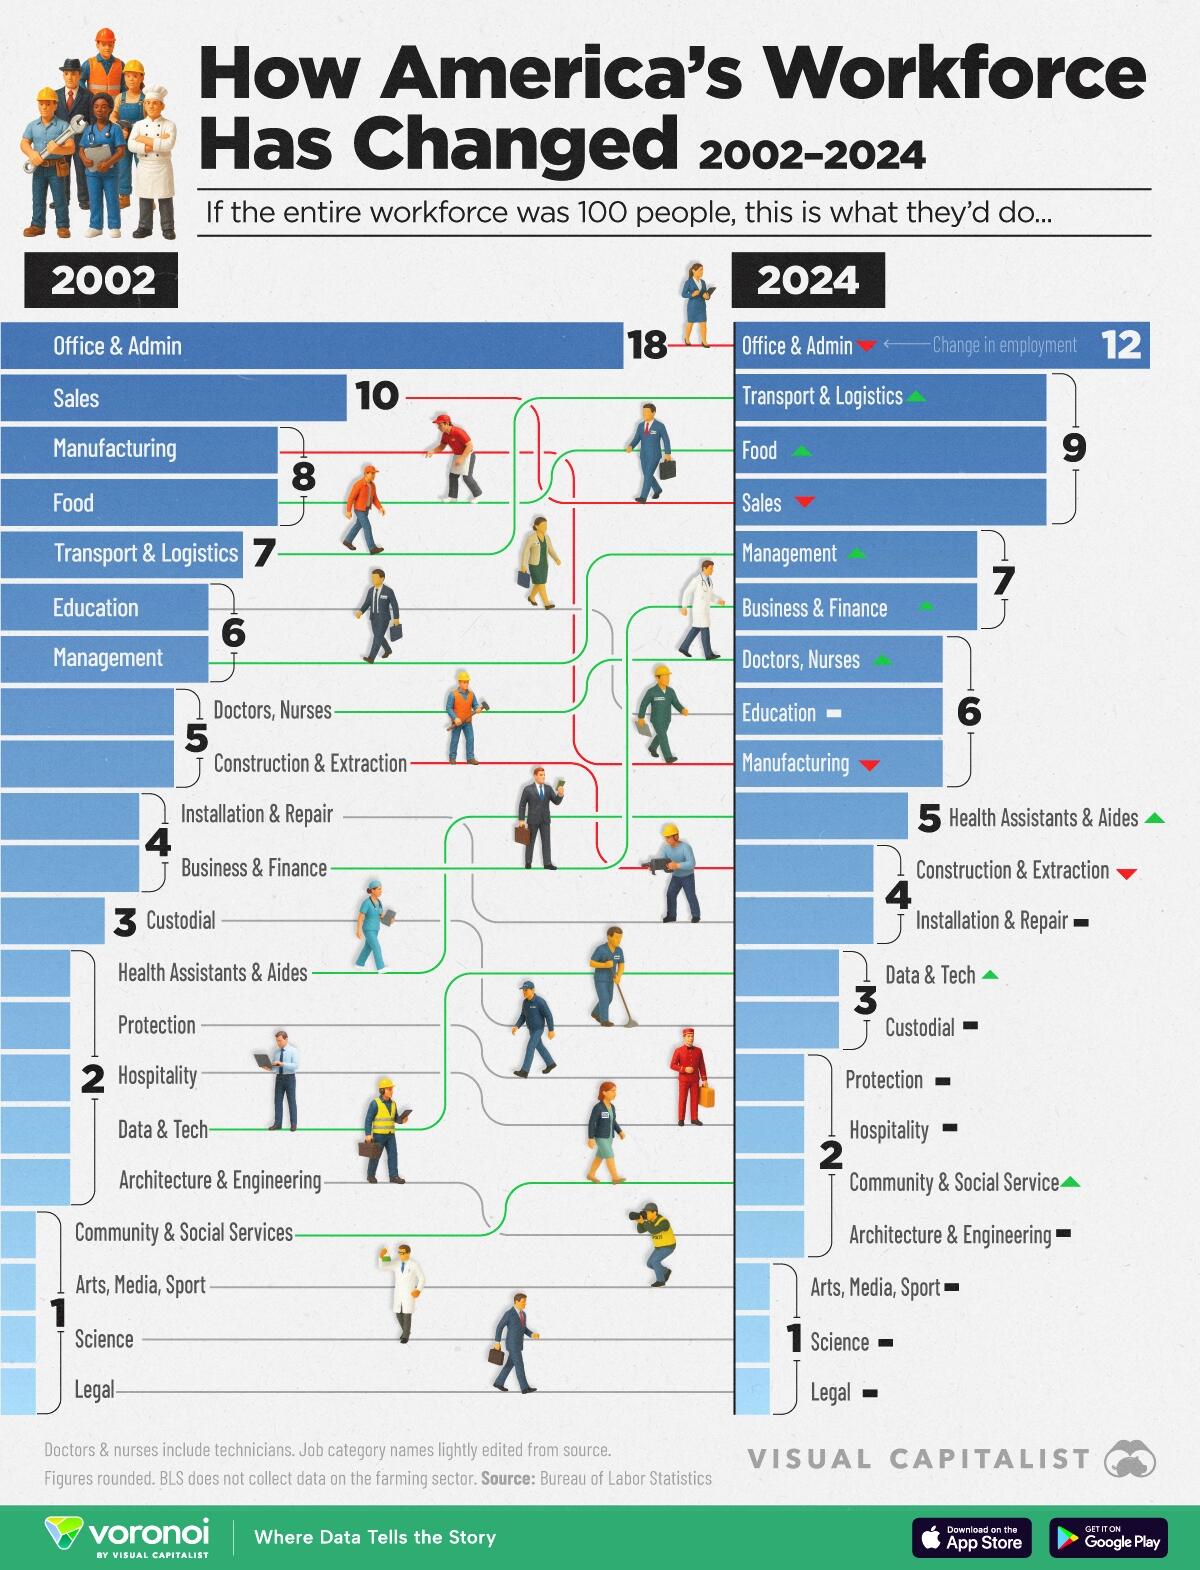
The visualization, via Visual Capitalist’s Pallavi Rao, compares how 100 hypothetical workers were distributed across occupations in 2002 versus 2024. It revealing which fields lost—or gained—share during a period marked by globalization, new technology, and a pandemic.
The data for this visualization comes from the U.S. Bureau of Labor Statistics’ Occupational Employment and Wage Statistics, which track headcounts across more than 800 detailed job categories.
Those categories are grouped into 21 broad buckets, visualized here, to spotlight long-term structural shifts in U.S. jobs.
ℹ️ BLS does not collect data on the agriculture sector, except for a few support categories.
Office Work is Still the Most Common U.S. Job
Back-office roles were once the backbone of white-collar employment.
But widespread adoption of enterprise software—from automated invoicing to cloud-based scheduling—has pared back demand.
| Rank | 2002 | 2002 Workforce as 100 People |
2024 | 2024 Workforce as 100 People |
|---|---|---|---|---|
| 1 | 🧑💼 Office & Admin | 18 | 🧑💼 Office & Admin | 12 |
| 2 | 📈 Sales | 10 | 🚚 Transport & Logistics | 9 |
| 3 | 🏭 Manufacturing | 8 | 🍽️ Food | 9 |
| 4 | 🍽️ Food | 8 | 📈 Sales | 9 |
| 5 | 🚚 Transport & Logistics | 7 | 👔 Management | 7 |
| 6 | 🎓 Education | 6 | 💹 Business and Financial | 7 |
| 7 | 👔 Management | 6 | 🩺 Doctors, Nurses, Technicians | 6 |
| 8 | 🩺 Doctors, Nurses, Technicians | 5 | 🎓 Education | 6 |
| 9 | 🏗️ Construction & Extraction | 5 | 🏭 Manufacturing | 6 |
| 10 | 🔧 Installation & Repair | 4 | 🧑⚕️ Health Assistants & Aides | 5 |
| 11 | 💹 Business & Financial | 4 | 🏗️ Construction & Extraction | 4 |
| 12 | 🧹 Custodial | 3 | 🔧 Installation & Repair | 4 |
| 13 | 🧑⚕️ Health Assistants & Aides | 2 | 💻 Data & Tech | 3 |
| 14 | 🛡️ Protection | 2 | 🧹 Custodial | 3 |
| 15 | 🏨 Hospitality | 2 | 🛡️ Protection | 2 |
| 16 | 💻 Data & Tech | 2 | 🏨 Hospitality | 2 |
| 17 | 📐 Architecture & Engineering | 2 | 🤝 Community & Social Service | 2 |
| 18 | 🤝 Community & Social Services | 1 | 📐 Architecture & Engineering | 2 |
| 19 | 🎭 Arts, Media, Sport | 1 | 🎭 Arts, Media, Sport | 1 |
| 20 | 🔬 Science | 1 | 🔬 Science | 1 |
| 21 | ⚖️ Legal | 1 | ⚖️ Legal | 1 |
| 22 | 🌾 Farming, Fishing, and Forestry | 0 | 🌾 Farming, Fishing, and Forestry | 0 |
| N/A | 🌐 All Occupations | 100 | 🌐 All Occupations | 100 |
Note: Figures are rounded.
Between 2002 and 2024, Office & Administrative workers went from 18% of the employed workforce to 12%.
Even with the rise of hybrid work, clerical duties are increasingly handled by self-service portals and AI chatbots, leaving fewer traditional desk jobs.
The decline underscores how routine cognitive tasks are nearly as vulnerable to automation as factory work.
Despite this, Office & Administrative jobs are still the largest category by number of workers (12 per 100), even in 2024.
Services Surge in Transport, Food, and Healthcare
While clerical and manufacturing roles receded, service-oriented fields expanded.
Transport & Logistics now has nine workers per 100, compared to seven in 2002, buoyed by e-commerce that multiplies parcel volumes and warehouse positions.
Food Service has also climbed, reflecting a consumer shift toward dining out and delivery.
Healthcare saw twin gains: Doctors/Nurses/Technicians held steady at six workers per 100, while Health Assistants & aides rose from two to five workers as an aging population demands more support staff.
Together, these categories illustrate how in-person, non-routine work remains resilient.
High-Skill Roles Grow—but So Do Inequalities
Both Management and Data & Tech occupations added roughly one worker per 100 since 2002, mirroring a broader pivot toward knowledge work.
Overall, the workforce is more diversified, with less concentration in a few dominant sectors.
The shift reflects structural change: technology is reducing clerical jobs while demographic and digital trends are fueling growth in healthcare and tech.
If you enjoyed today’s post, check out The Most Common Job in Each U.S. State in 2024 on Voronoi, the new app from Visual Capitalist.
Tyler Durden
Sat, 08/16/2025 – 19:15ZeroHedge News

 R1
R1
 T1
T1


