
U.S. Housing Heat Map Signals Ongoing Deceleration As Buyers Wait For Lower Rates
New residential housing construction momentum continued cooling in August, with permits under pressure nationally, particularly in the South and West. Builders are managing inventory tightly while awaiting further Federal Reserve interest rate cuts to hopefully revive demand, with Midwest markets standing out as relative outperformers. Many buyers remain sidelined by affordability woes, as elevated mortgage rates and high home prices crush demand, and a softening labor market now adds to the challenges.
A team of Goldman analysts, led by Susan Maklari, penned a note on Tuesday that provides a heat map for the nation’s housing market, showing that falling housing permits signal the real estate market shifted into a lower gear. Builders are more cautious in late year, buyers are waiting for the Fed Chair Powell to unleash another round of interest rate cuts, and home price growth has stalled. The Midwest is holding up, but the South and West markets are softening the fastest.
Here are the key takeaways from Maklari’s note on the national housing market outlook:
-
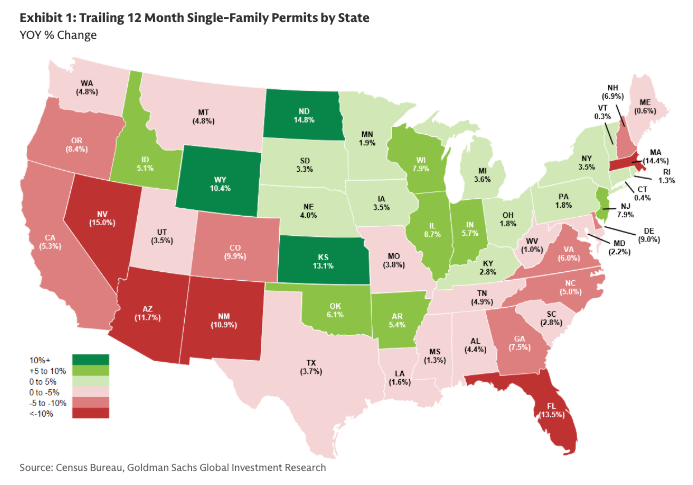
Permits Slow: On a trailing 12-month basis, single-family permits fell 5% YoY in August (vs -3% in July, +14% a year ago).
-
Buyers Hesitant: Traffic hasn’t translated into sales as buyers wait on potential Fed cuts and worry about employment, especially at the entry level.
-
Inventory Management: Builders are keeping inventory light heading into 2026 as cycle times shorten.
-
Spec Homes Rising: Completed specs hit their highest since July 2009.
-
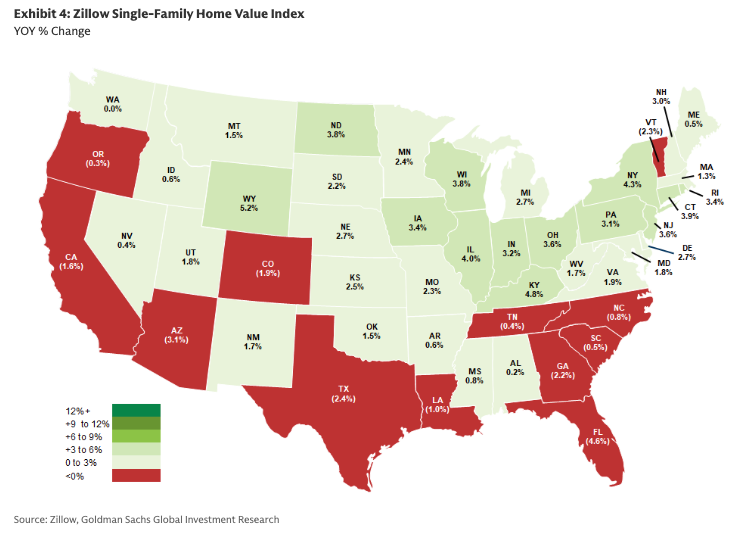
Home Values Flat: Zillow shows national prices flat YoY, with only 1 state seeing >5% gains. Florida (-5%), Arizona (-3%), and California/Colorado/Georgia/Texas (-2% each) declined, while Utah and Virginia rose +2%.
-
Macro View: Expect demand volatility through year-end, but rates cuts (two 25bps forecast in 2025) could spark a rebound. Top picks: MTH, DHI.
“Instead, buyers are waiting out the potential for further Fed rate cuts while increased concerns around employment give some pause, especially in the entry-level. Given conditions and greater flexibility as cycle times shorten, builders are looking to enter 2026 with less inventory, suggesting permits will remain under pressure through year-end, at least. We also note completed single-family specs are at their highest level since July 2009,” Maklari wrote in the note.
Geographical breakdown:
-
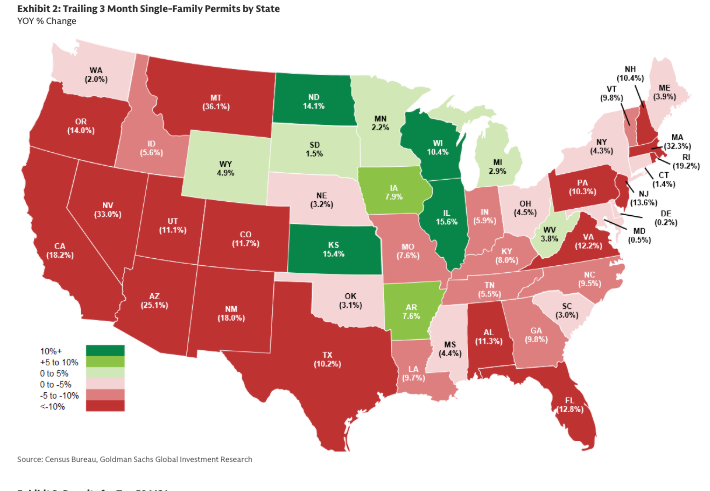
Activity Moderates on a Rolling 3-Month Basis Led by Nevada, Arizona, and California: Single-family permits for the 3-months ended August fell 10% YOY compared to an 8% decrease in July and a 1% decline a year ago. They were flat vs the comparable pre-pandemic period. Looking at the largest new home markets, the deceleration was led by Nevada, down 33% YOY, followed by Arizona off 25% and California down 18%. Nationally, we note 11 states were flat to up vs 17 last month. This comes as builders look to align starts with demand, while focusing on profitability and cash generation. As such, we expect permits will remain under pressure.
-
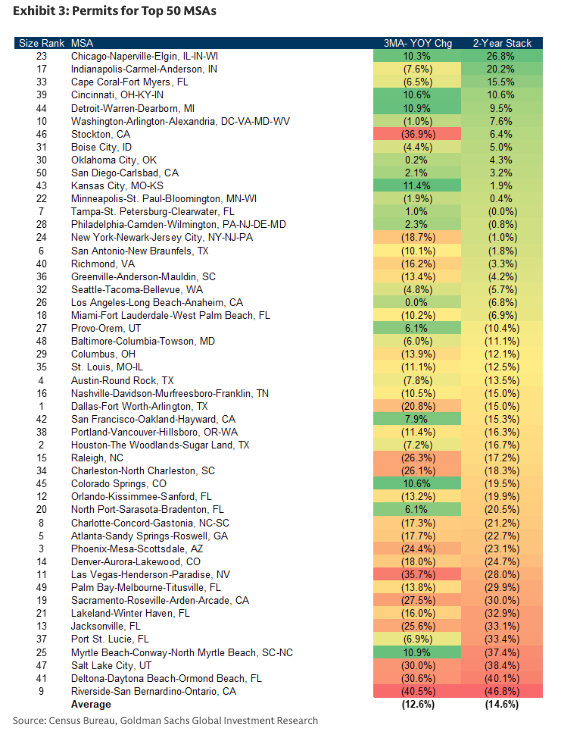
Southern Markets Lead MSA Level Declines Offset by Gains in the Midwest: Permits in the top 50 MSAs declined 13% YOY for the 3 months ended August vs down 11% in July and -2% a year ago. On a YOY basis, Kansas City, MO, Detroit, MI, and Myrtle Beach, SC (+11% each) showed the greatest gains while Riverside, CA (-40%), Stockton, CA (-37%), and Las Vegas, NV (-36%) lagged. On a 2-year stacked basis, growth was led by Chicago, IL (+27%), Indianapolis, IN (+20%), and Cape Coral, FL (+16%). We highlight 4 of the top 10 MSAs are in Midwest, with the South and West largely underperforming, on a 2-year stack basis.
Trailing 12 Month Single-Family Permits by State
Trailing 3 Month Single-Family Permits by State
Permits for Top 50 Cities
Zillow Single-Family Home Value Index
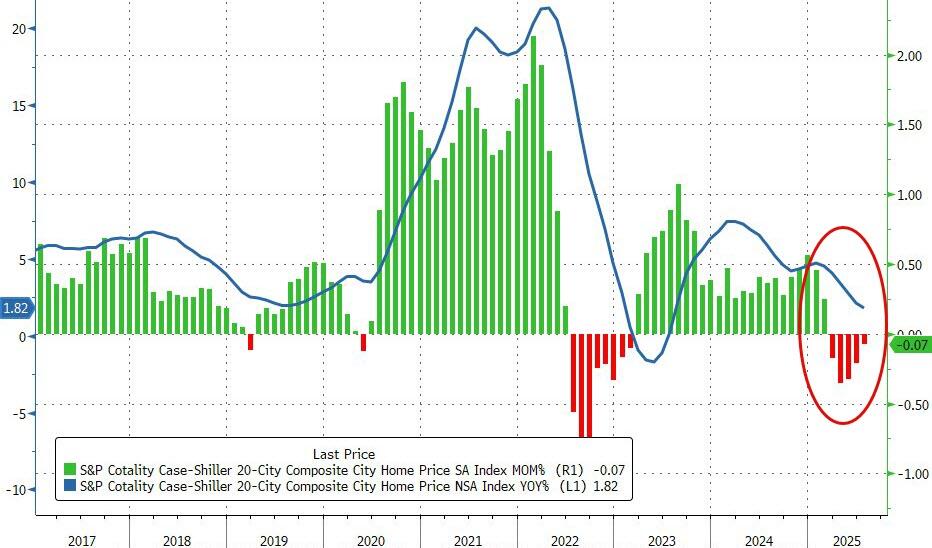
Goldman’s note on the cooling real estate market comes the same day Case-Shiller data for July (read report) showed national home prices declined for the fifth straight month.
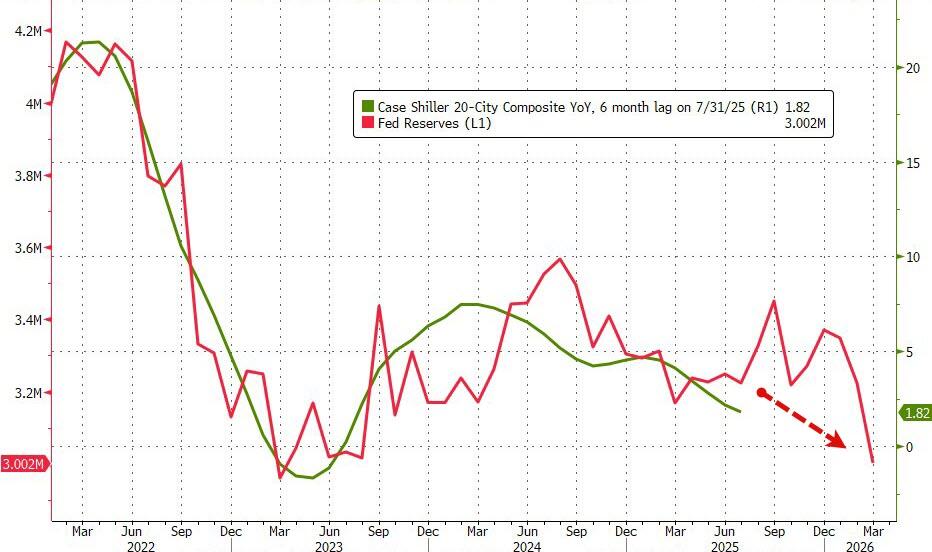
As we highlighted in our report, home price changes tend to track closely with bank reserves at the Fed on a six-month lag, and this only implies prices could decelerate in the new year following a brief rebound.
ZeroHedge Pro Subs can read the complete report in the usual place.
Tyler Durden
Wed, 10/01/2025 – 15:00ZeroHedge NewsRead More

 R1
R1
 T1
T1


