

Mapping Extreme Poverty Across All American States
In 2024, 6% of the U.S. population lived in extreme poverty, equal to 20.4 million people.
While there are different definitions of extreme poverty, this is represented as those earning less than $8,160 in annual income, or half of the poverty line. As the federal budget makes cuts to food assistance and healthcare, levels of extreme poverty run the risk of worsening even further.
This graphic, viaVisual Capitalist’s Dorothy Neufeld, shows the share of each state living in extreme poverty in 2024, based on data from the U.S. Census Bureau.
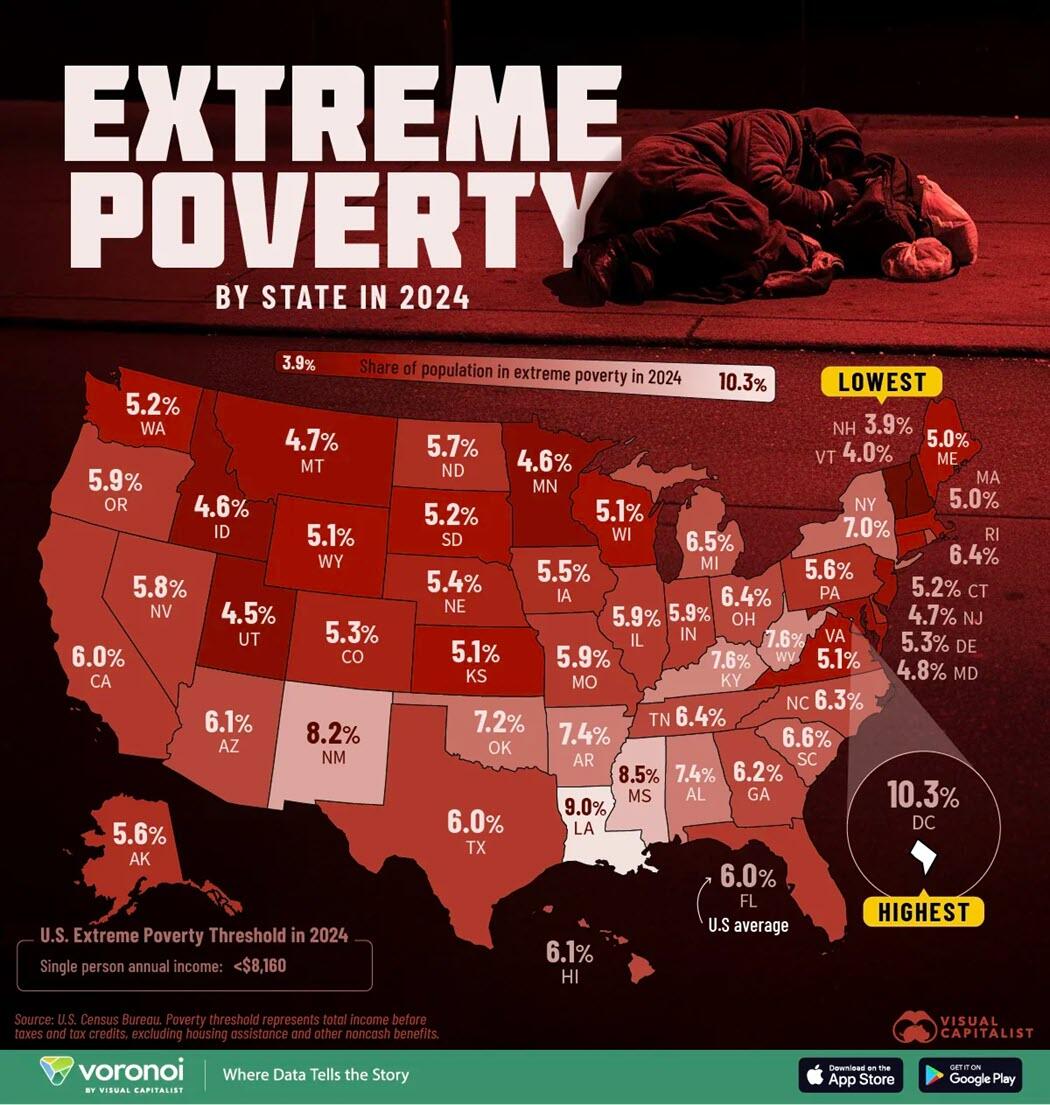
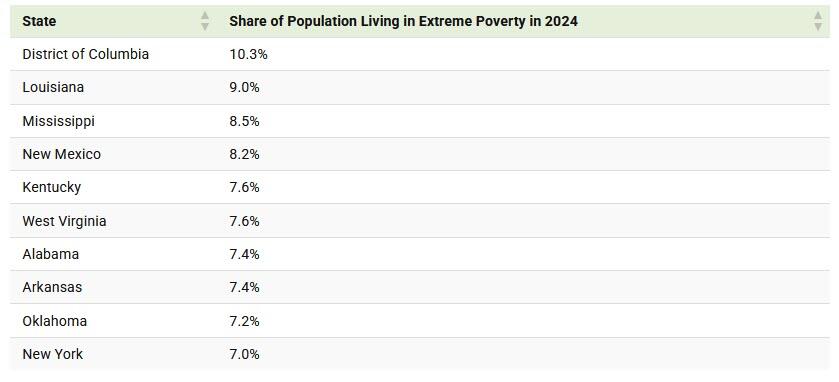
Washington D.C. Has the Highest Level of Extreme Poverty
Last year, more than one in 10 residents of the nation’s capital lived in extreme poverty.
Going further, economic hardship disproportionately impacts people of color in Washington D.C., with one in three black children living in poverty between 2019 and 2023, on average.
As we can see, Southern states also rank among the most impoverished. In Louisiana, 9% of residents live in extreme poverty, and on average, 18.9% lived below the poverty line between 2021 and 2023.
Meanwhile, 7% of New York’s population are extremely impoverished, equal to an estimated 1.4 million people.
On the other end of the spectrum is New Hampshire with the lowest rate nationally, at 3.9%. The Granite State benefits from a stable job market, low unemployment, and a strong education system. Paired with relatively affordable healthcare, these factors contribute to higher living standards for its residents, reducing the risk of poverty.
Tyler Durden
Mon, 10/06/2025 – 19:20ZeroHedge NewsRead More


 R1
R1
 T1
T1


