

Bank of America Shares Jump On Stellar Q3 Results
After yesterday’s solid Q3 results from banking giants JPM, Wells, Citi and Goldman, the earnings juggernaut continued this morning with Bank of America reporting third-quarter earnings that also beat estimates across the board, as investment-banking activity increased amid a long-awaited comeback in M&A and net interest income topped analysts’ estimates.
Here are the full details from the company’s Q3 results:
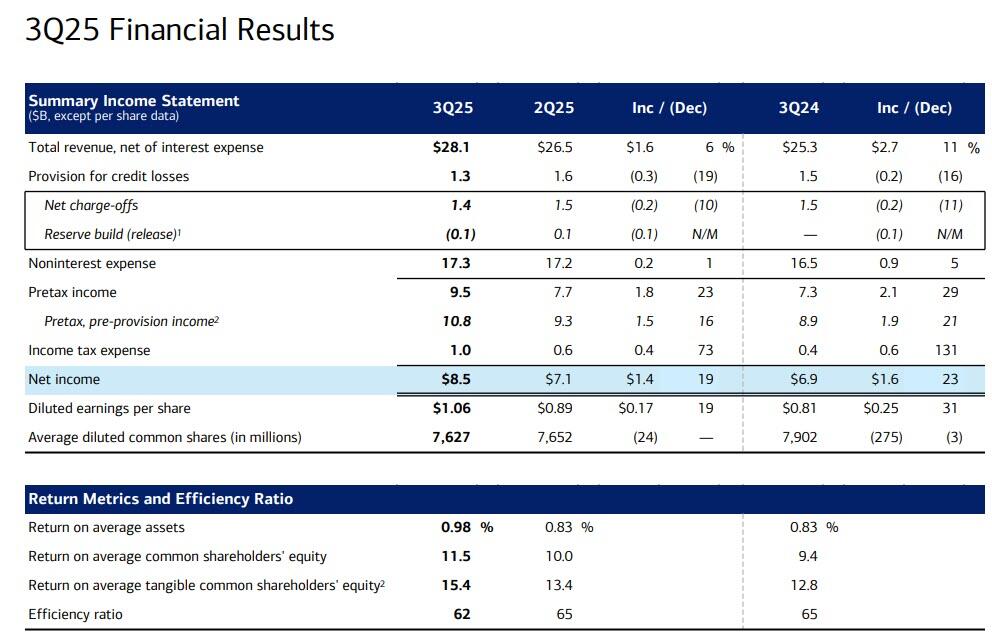
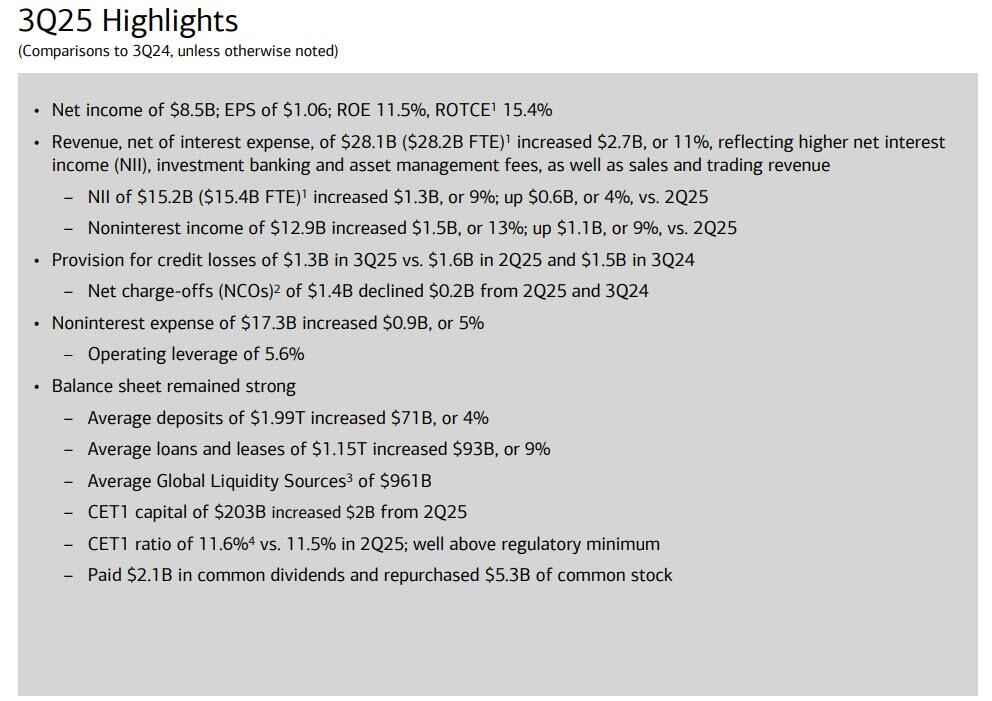
- Diluted EPS $1.06, up 19% YoY, beating estimates of $0.95
- Revenue $28.09BN, up 6% YoY, beating estimates of $27.51BN
- Trading revenue (ex-DVA) $5.35 billion, beating estimates of $5.01 billion
- FICC trading revenue excluding DVA $3.08 billion, missing estimates of $3.1 billion
- Equities trading revenue excluding DVA $2.27 billion, beating estimates of $2.08 billion
- Wealth & investment management total revenue $6.31 billion, beating estimates of $6.28 billion
- Trading revenue (ex-DVA) $5.35 billion, beating estimates of $5.01 billion
- Net income $8.47 billion, up 23%
And visually:
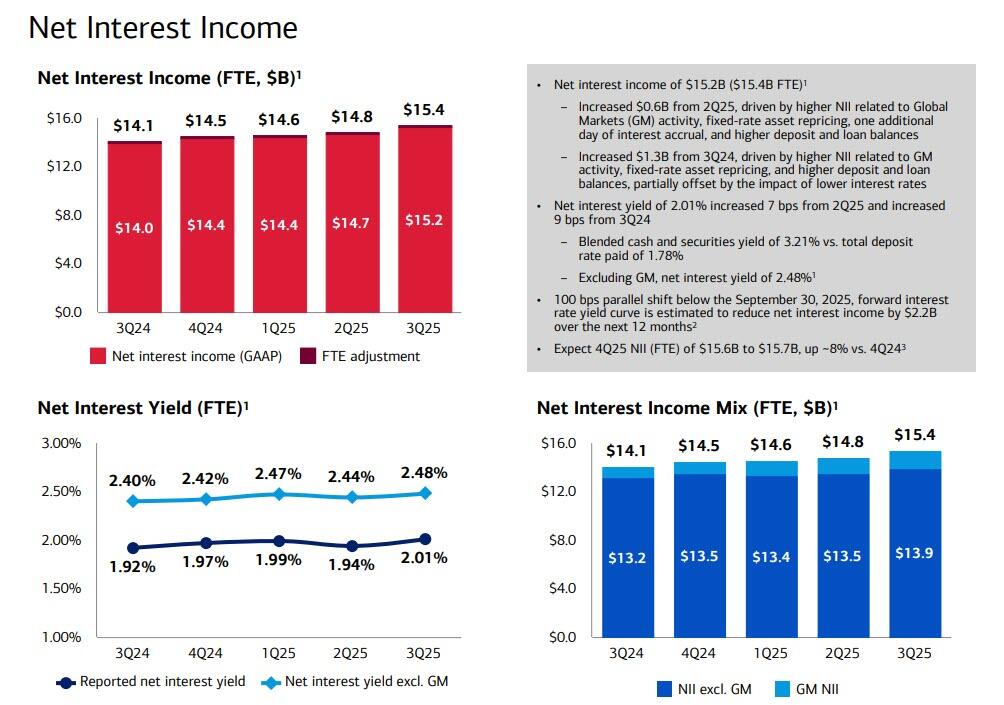
The second-largest US bank also said that net interest income, a key source of revenue for the company, climbed 9.1% to $15.2 billion. Analysts had expected a 7.6% increase for NII, the revenue collected from loan payments minus what depositors are paid. Net Interest Yield also rose.
- Net interest income (FTE) $15.39 billion, beating estimates of $15.25 billion
- Net interest income $15.23 billion, beating estimates of $15.03 billion
- Increased $1.3B from 3Q24, driven by higher NII related to GM activity, fixed-rate asset repricing, and higher deposit and loan balances, partially offset by the impact of lower interest rates
- Net interest yield of 2.01%, beating estimates of 1.98%, and up 7 bps from 2Q25, up 9 bps from 3Q24
- Blended cash and securities yield of 3.21% vs. total deposit rate paid of 1.78%
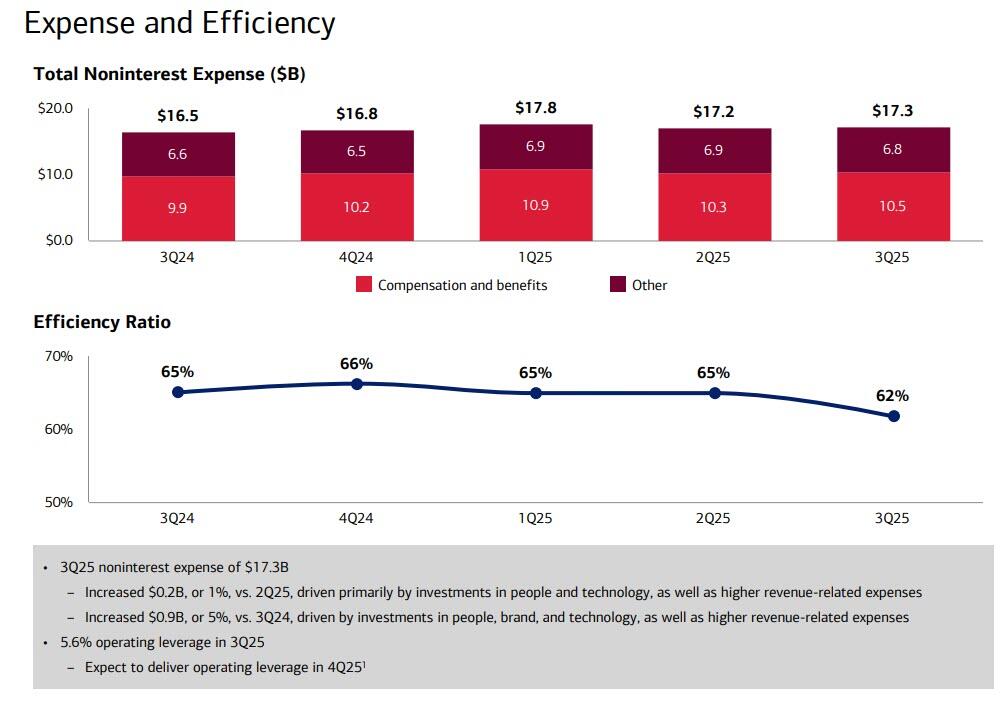
Turning to the expense side of the income statement, total Q3 compensation expenses were $10.52 billion, above the estimate $10.44 billion. The total Noninterest expense of $17.34BN (higher than the est $17.3BN), increased $0.9B, or 5%, vs. 3Q24, driven by investments in people, brand, and technology, as well as higher revenue-related expenses. The efficiency ratio declined to 62% from 65%, the lowest in over a year.
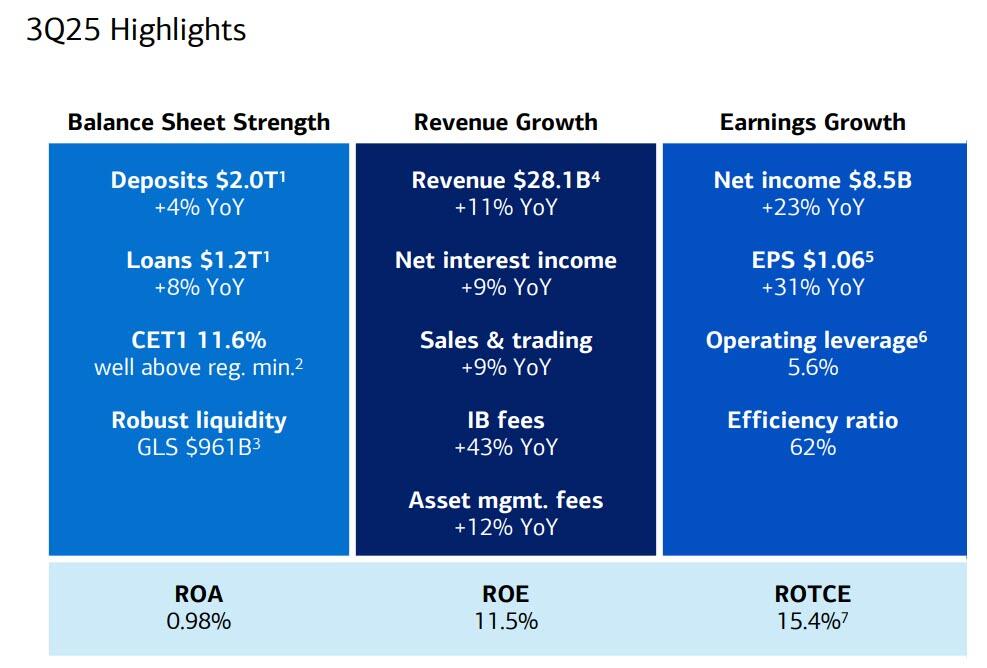
Here are the Q3 highlights as reported by the bank:
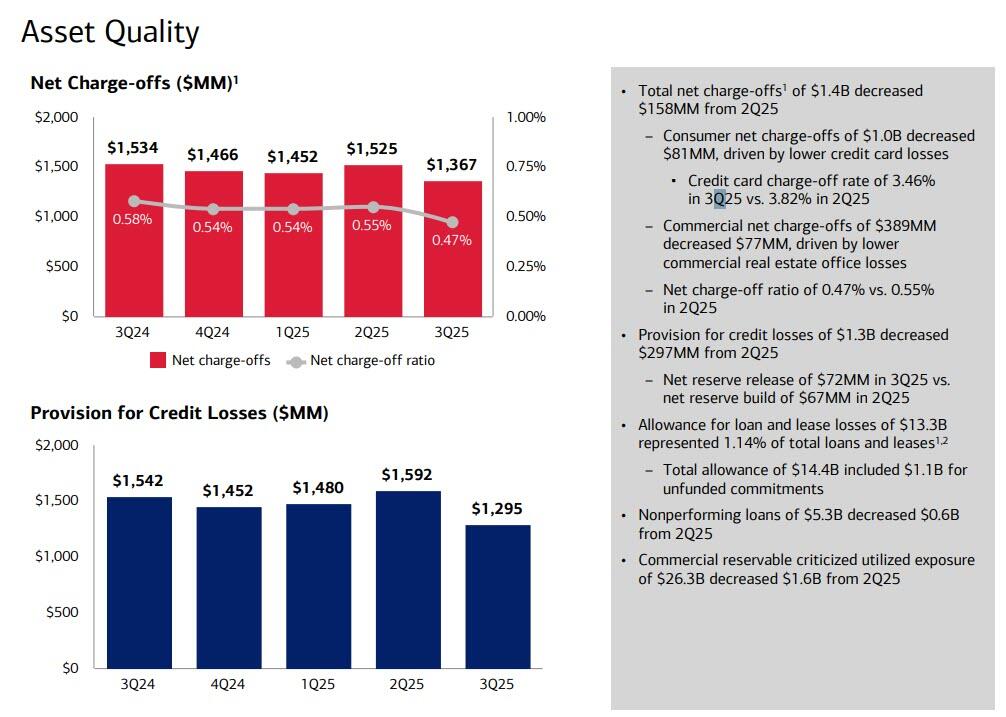
With the Tricolor and First Brands bankruptcies fresh, everyone will be looking at the company’s Asset Quality data. Here is the breakdown:
Total net charge-offs of $1.37B, below the est $1.52B, and down $158MM from 2Q25
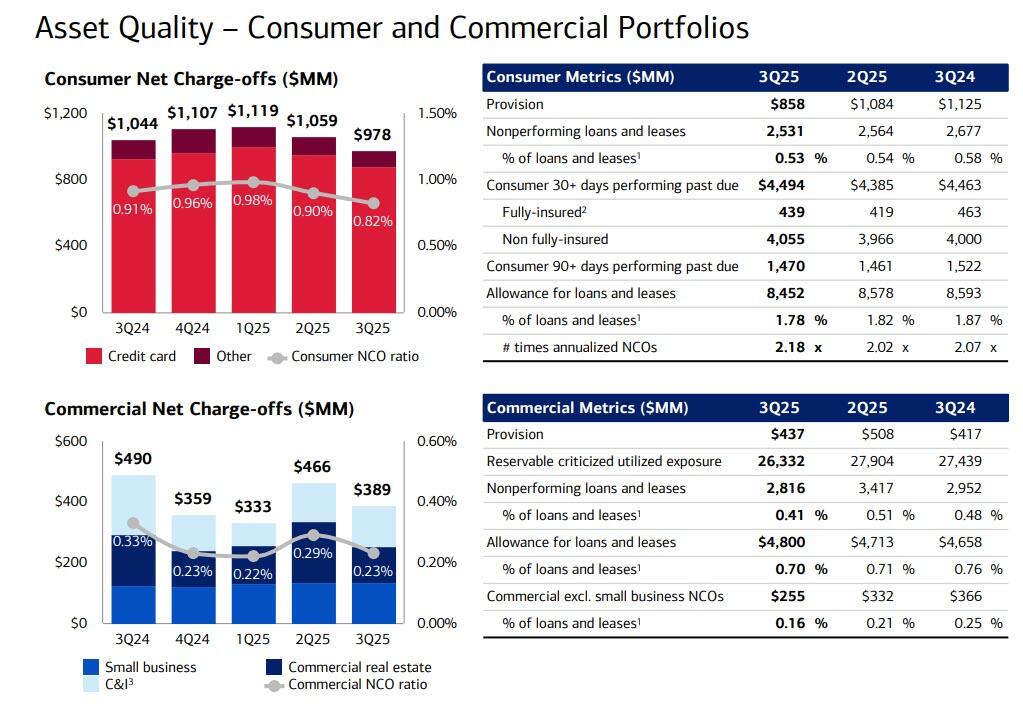
- Consumer net charge-offs of $1.0B decreased $81MM, driven by lower credit card losses
- Credit card charge-off rate of 3.46% in 3Q25 vs. 3.82% in 2Q25
- Commercial net charge-offs of $389MM decreased $77MM, driven by lower commercial real estate office losses
- Net charge-off ratio of 0.47% vs. 0.55% in 2Q25
Provision for credit losses of $1.3B, down $297MM from 2Q25, and below estimates of $1.61 billion
- Net reserve release of $72MM in 3Q25 vs. net reserve build of $67MM in 2Q25
- Allowance for loan and lease losses of $13.3B represented 1.14% of total loans and leases
- Total allowance of $14.4B included $1.1B for unfunded commitments
- Nonperforming loans of $5.3B decreased $0.6B from 2Q25
- Commercial reservable criticized utilized exposure of $26.3B decreased $1.6B from 2Q25
A look at the bank’s balance sheet, liquidity and capital:
- Return on average equity 11.5%, beating estimates of 10.4%
- Return on average assets 0.98%, beating estimates of 0.86%
- Return on average tangible common equity 15.4%, estimate 13.9%
- Basel III common equity Tier 1 ratio fully phased-in, advanced approach 13.1%, estimate 13.3%
- Standardized CET1 ratio 11.6%, estimate 11.4%
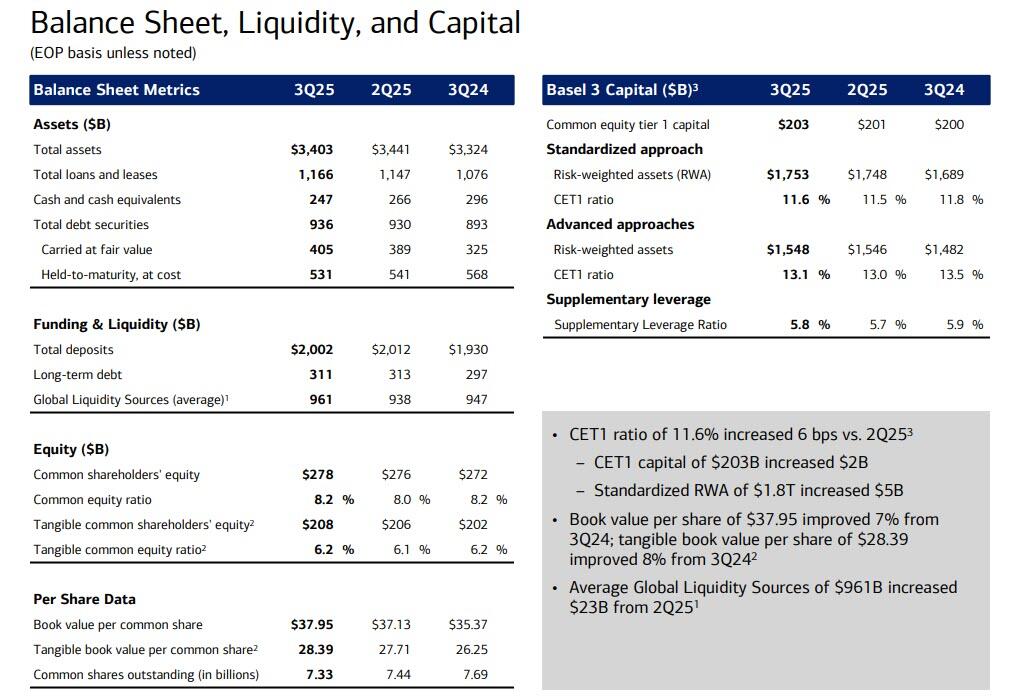
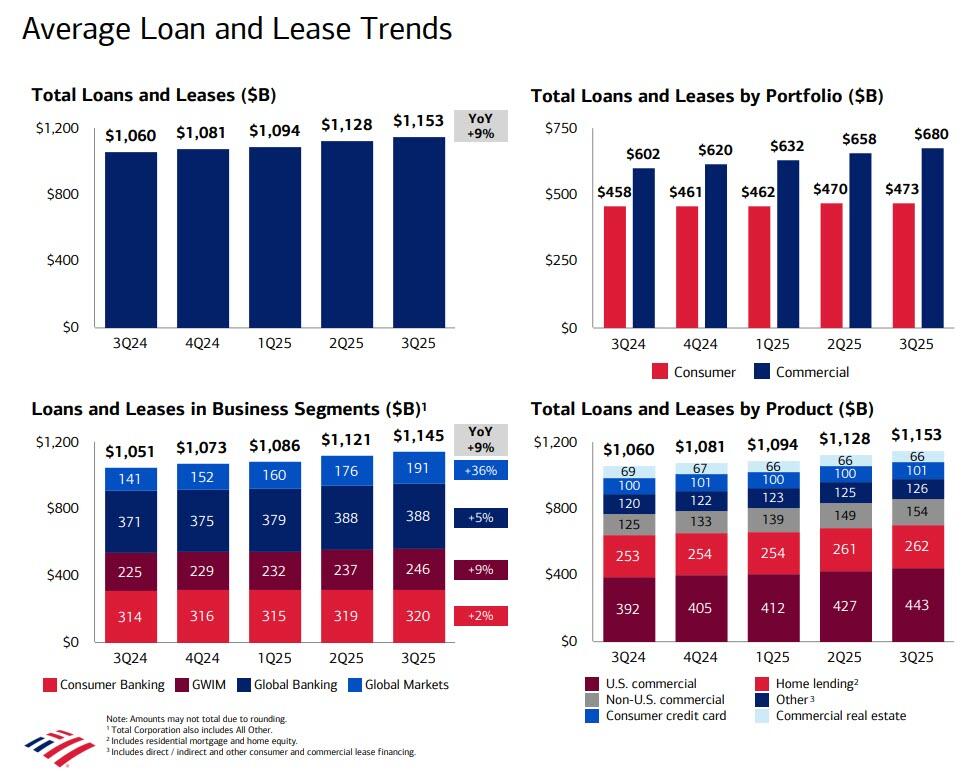
Looking at the composition of the balance sheet, total loans rose to $1.17 trillion, above the estimate of $1.16 trillion..
… while total deposits also rose $2.00 trillion, but missed estimates of $2.02 trillion
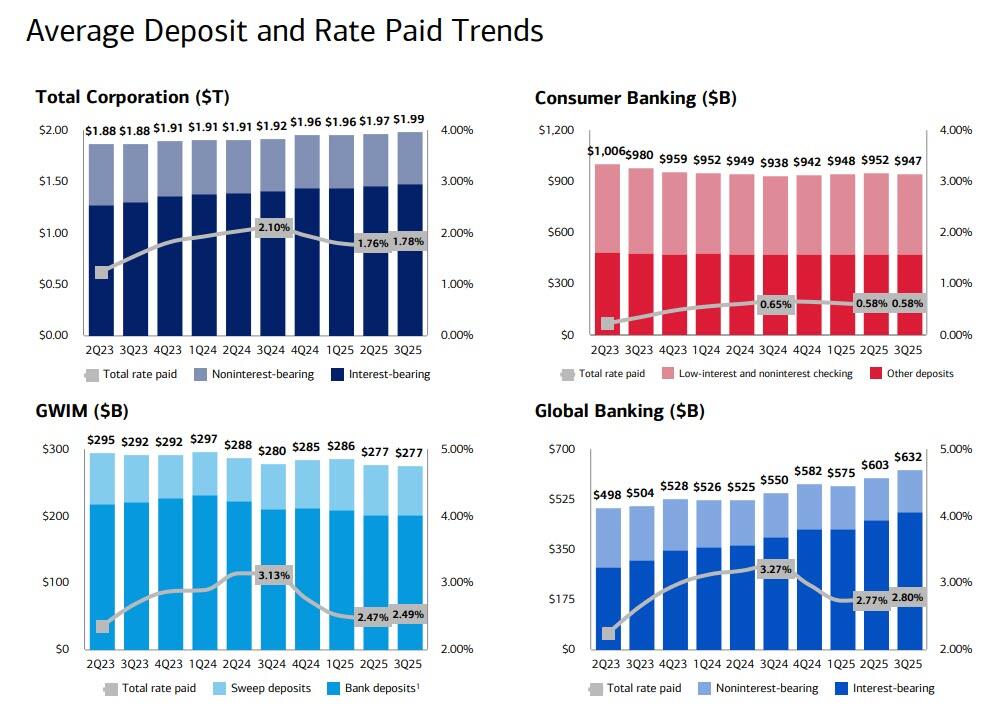
“Strong loan and deposit growth, coupled with effective balance sheet positioning, resulted in record net interest income,” Chief Executive Officer Brian Moynihan said in a statement Wednesday. “We also saw strong fee performance from our market-facing businesses.”
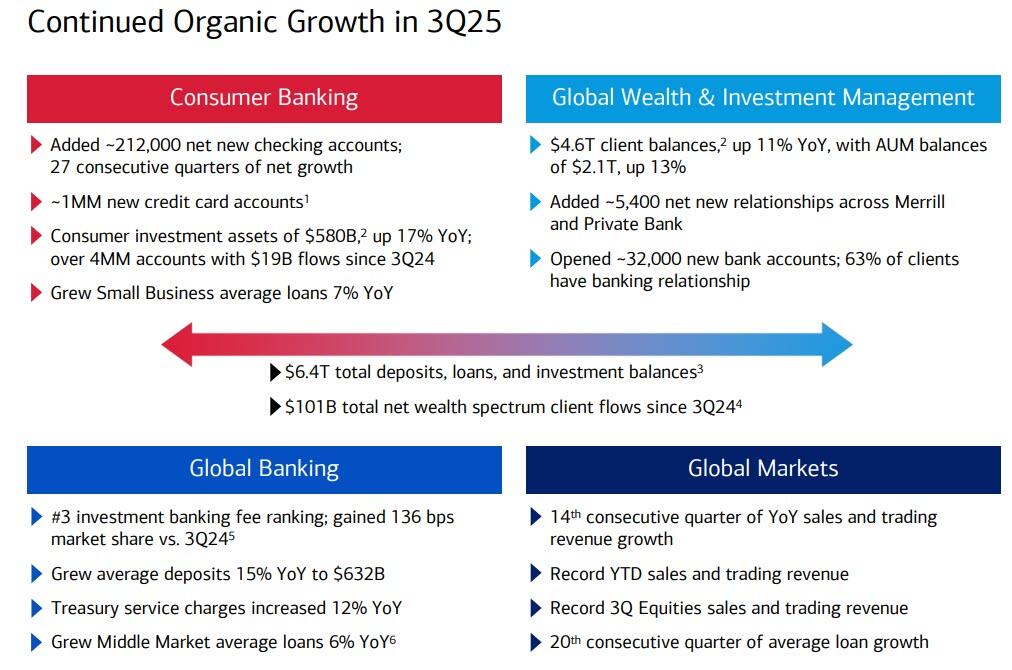
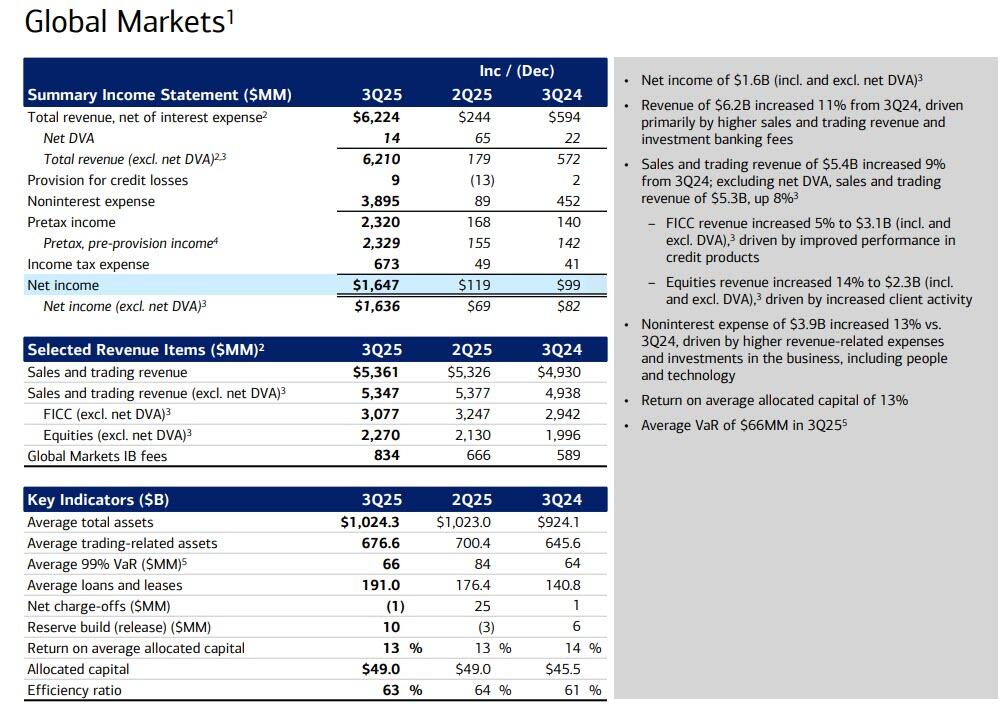
While not nearly as strong as Goldman or JPM, BofA’s global markets group delivered solid results again: Net income was $1.6B, up modestly from a year ago; total revenue of $6.2B increased 11% from 3Q24, driven primarily by higher sales and trading revenue and investment banking fees. The third quarter saw steady trading volumes as investors repositioned around President Donald Trump’s volatile tariff policies and changing geopolitics. Here is the snapshot:
- Trading revenue excluding DVA $5.35 billion, beating estimate $5.01 billion, largely thanks to equities.
- FICC trading revenue excluding DVA $3.08 billion, estimate $3.1 billion, driven by improved performance in credit products
- Equities trading revenue excluding DVA $2.27 billion, estimate $2.08 billion, driven by increased client activity
Average VaR of $66MM in 3Q25, down from $84MM in Q2, but up from $64 a year ago.
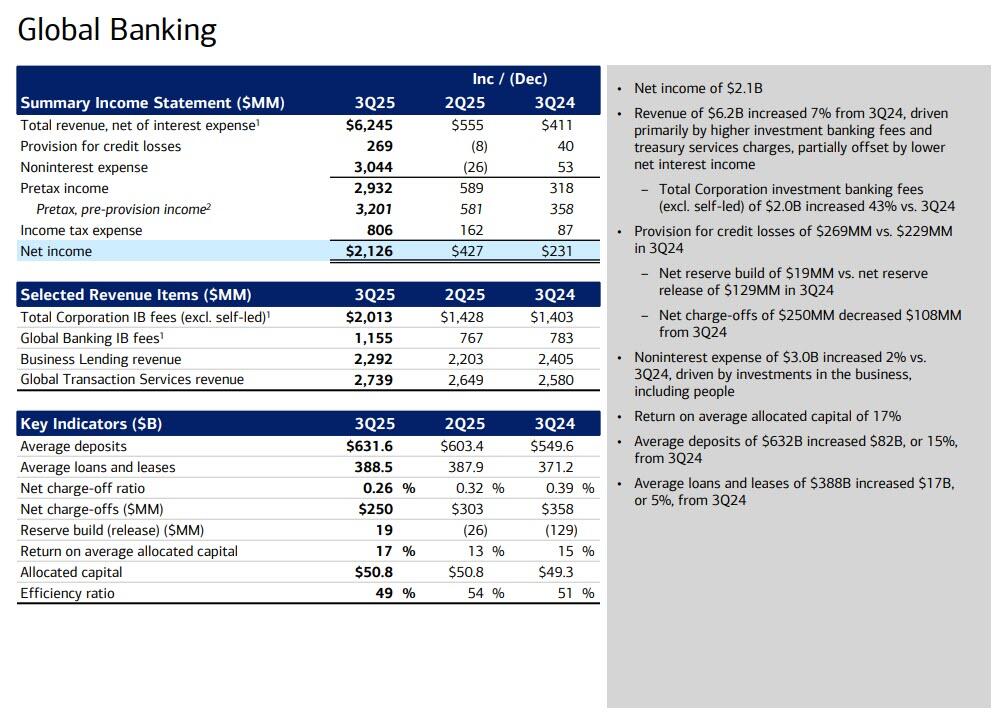
Turning to banking, total revenue of $6.2B increased 7% from 3Q24, driven primarily by higher investment banking fees and treasury services charges, partially offset by lower net interest income. Investment-banking revenue rose 43% to $2.01 billion, better than the $1.65 billion that analysts had expected. Fees for advising on mergers and acquisitions soared 51% to $583 million, and revenue from equity and debt issuance increased 34% and 42%, respectively:
- Investment banking revenue $2.01 billion, estimate $1.61 billion
- Advisory fees $583 million, estimate $446.7 million
- Debt underwriting rev. $1.11 billion, estimate $858.1 million
- Equity underwriting rev. $362 million, estimate $346.5 million
Bank of America’s results offered a further look at how the biggest US banks fared in another quarter during Trump’s second term. Investors are also eager to hear details on the national economy from executives whose firms cater to large swaths of American consumers and businesses.
On Tuesday, JPMorgan, Goldman and Citigroup reported third-quarter earnings with strong trading and investment-banking activity boosting results. Bank executives expect trading momentum to continue and the investment-banking pipeline to remain strong.
A wave of company takeovers is lifting dealmakers across Wall Street after trade uncertainty had stifled activity earlier in the year. Global deal values topped $1 trillion in a third quarter for only the second time on record, according to data compiled by Bloomberg, amid a slew of headline-grabbing transactions.
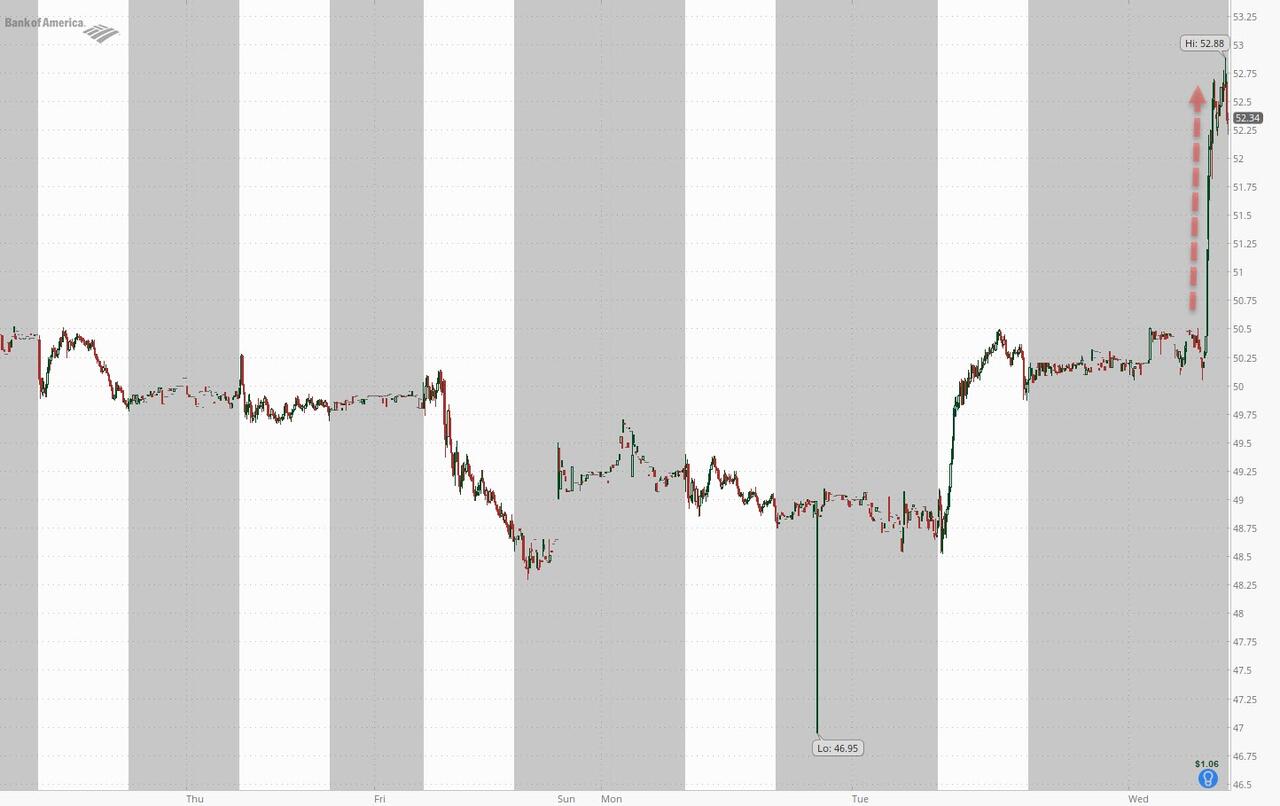
Shares of the Charlotte, North Carolina-based bank rose 4% at 7:03 a.m. in early New York trading. They’d gained 14% this year through Tuesday, more than the 10% increase for the S&P 500 Financials Index.
BofA’s Q3 presentation can be found below (pdf link).
Tyler Durden
Wed, 10/15/2025 – 08:14ZeroHedge NewsRead More


 R1
R1
 T1
T1


