
The United States Of Unemployment
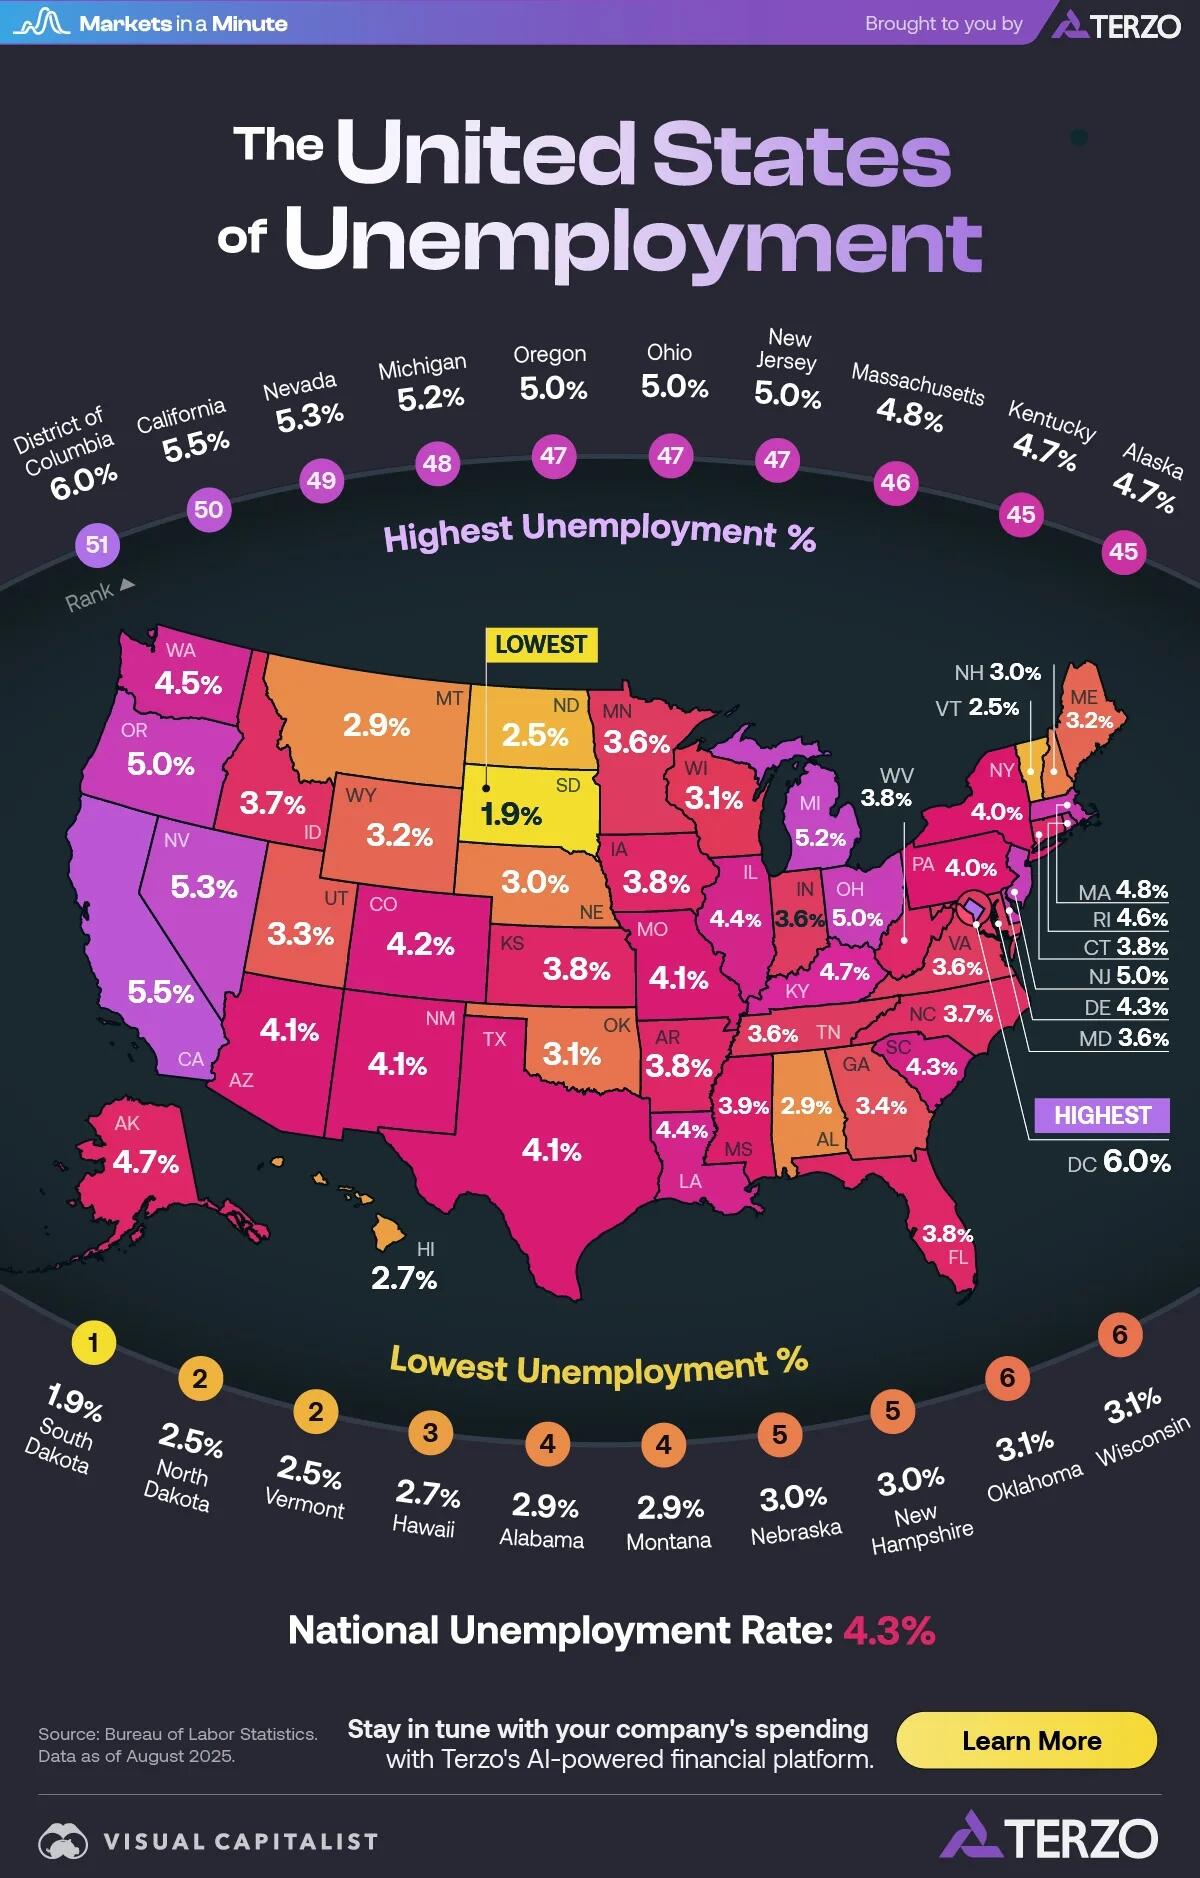
The national unemployment rate for the U.S. rose to 4.3% in August 2025. But that figure masks vast differences in local labor market health across states.
In this Markets in a Minute graphic, created in partnership with Terzo, Visual Capitalist’s Julia Wendling maps all 50 states and the District of Columbia by their August 2025 unemployment rates.
Data is from the Bureau of Labor Statistics.
The National Picture
The U.S. unemployment rate rose to 4.3% in August, up slightly from 4.2% in July.
This was the second consecutive monthly increase and the highest level since October 2021. Long-term unemployment, which tracks the share of those unemployed for 27 weeks or more, rose for the third month in a row in August.
According to Reuters, the uptick reflects a softening economy, as higher tariffs and widespread public-sector layoffs strain the labor market amid ongoing geopolitical uncertainty.
Unemployment Rates by State
At the top of the list with the lowest unemployment rates are South Dakota (1.9%), North Dakota (2.5%), and Vermont (2.5%).
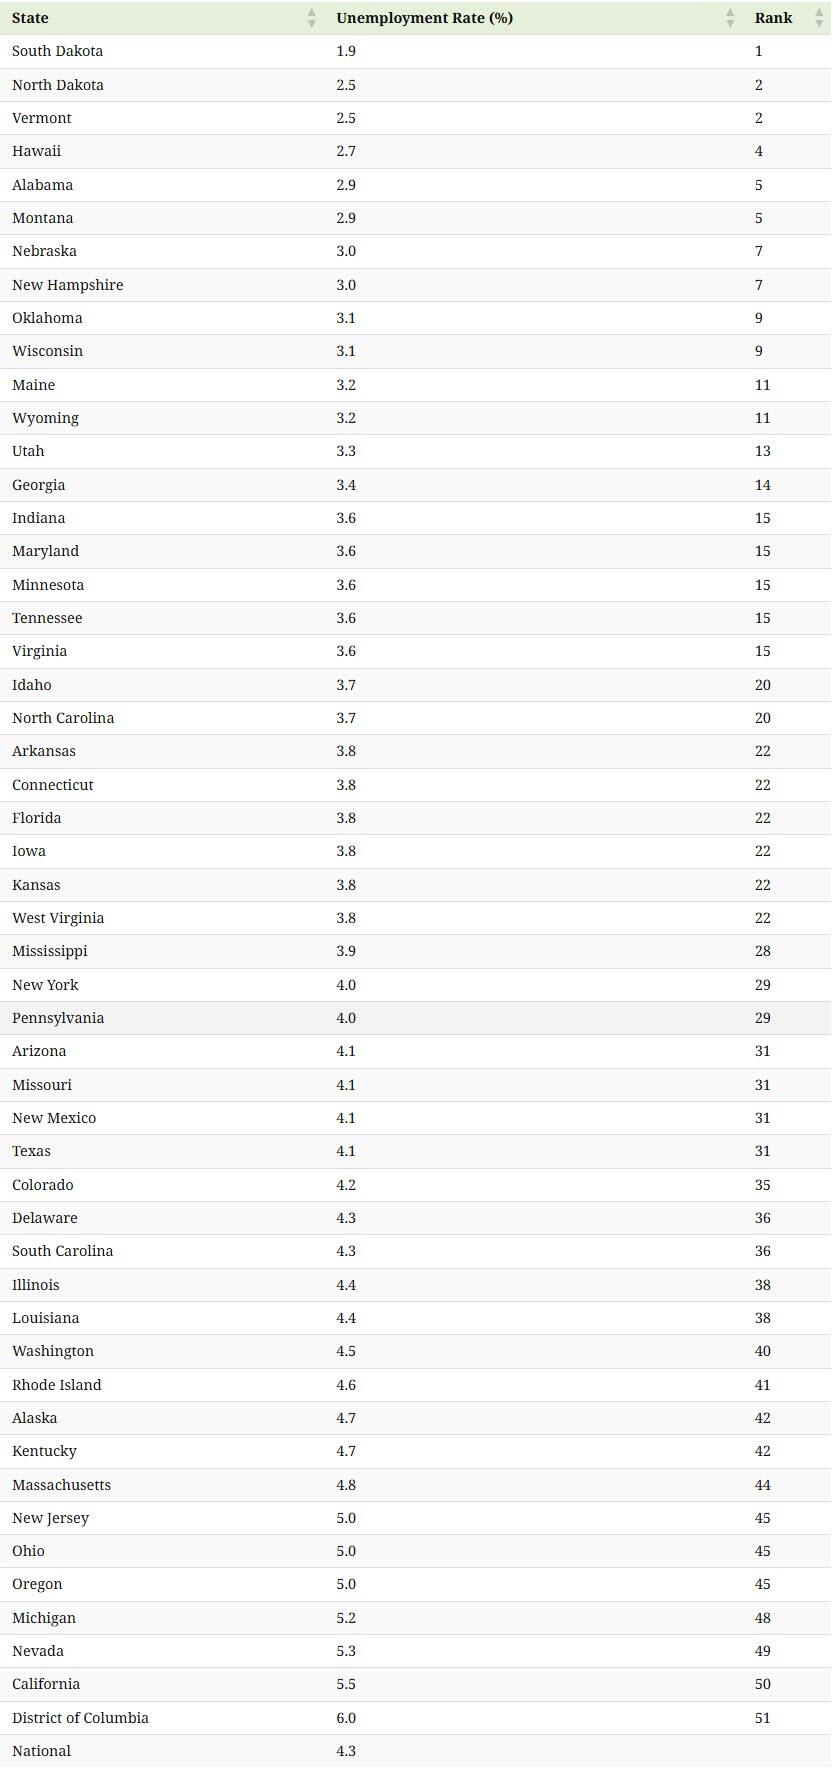
Conversely, California (5.5%), Nevada (5.3%), and Michigan (5.2%) are facing slower job growth. Tech layoffs and a weakening consumer spending profile are weighing on employment.
What’s Ahead
Economists and policymakers are closely watching for the delayed September employment report, postponed by the ongoing government shutdown. The report is a key indicator for investors, offering a clear read on the nation’s economic pulse and signaling areas of strength or weakness.
Tyler Durden
Tue, 11/04/2025 – 17:20ZeroHedge NewsRead More


 R1
R1
 T1
T1


