
Forward Return And The Importance Of Math
Authored by Lance Roberts via RealInvestmentAdvice.com,
During strongly trending bull markets, investors often overlook the importance of math in predicting forward returns. Such is easy to do when the market just seemingly continues to rise without regard to fundamentals. The current environment is also heavily influenced by the impact of “passive indexing,“ which has distorted market dynamics as well. However, none of this should be surprising, given one of the longest cyclical bull markets in history; individuals are optimistic about the long-term prospects of investing. The ongoing interventions by global Central Banks have led to T.T.I.D. (This Time Is Different) and T.I.N.A. (There Is No Alternative), which has become a pervasive, and “Pavlovian,“ investor mindset.
But as the famous Paul Harvey used to say: “Then there is the rest of the story.”
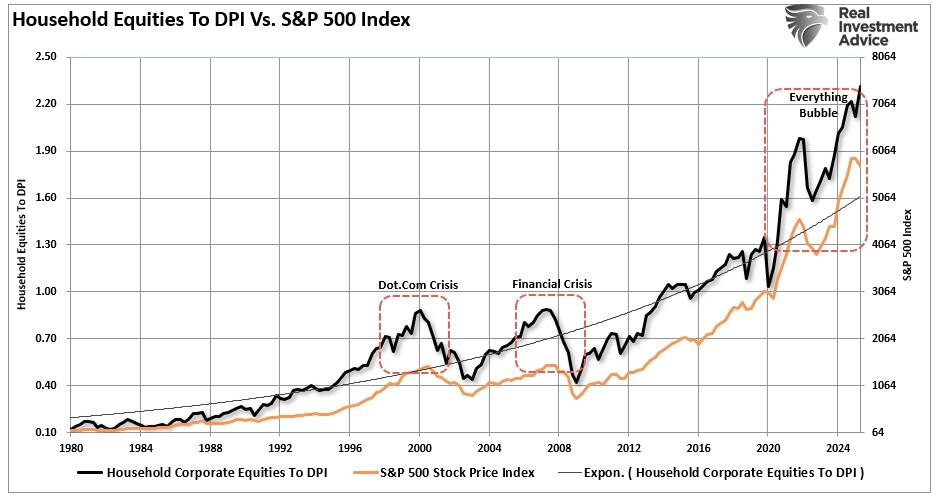
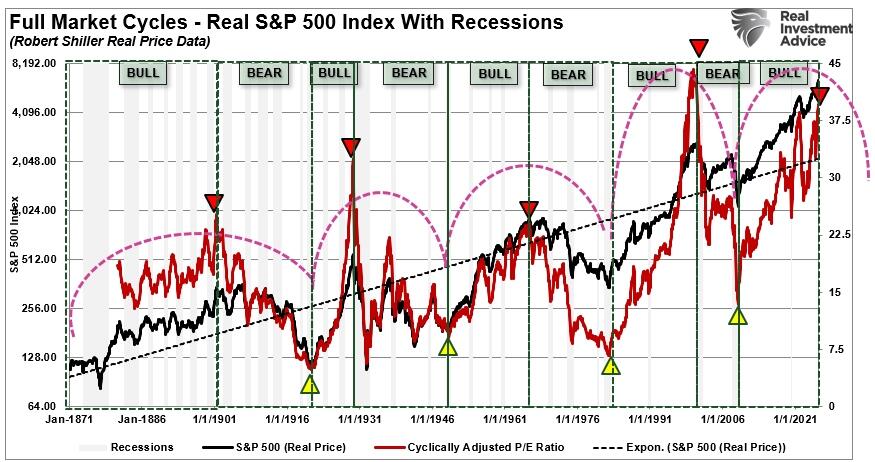
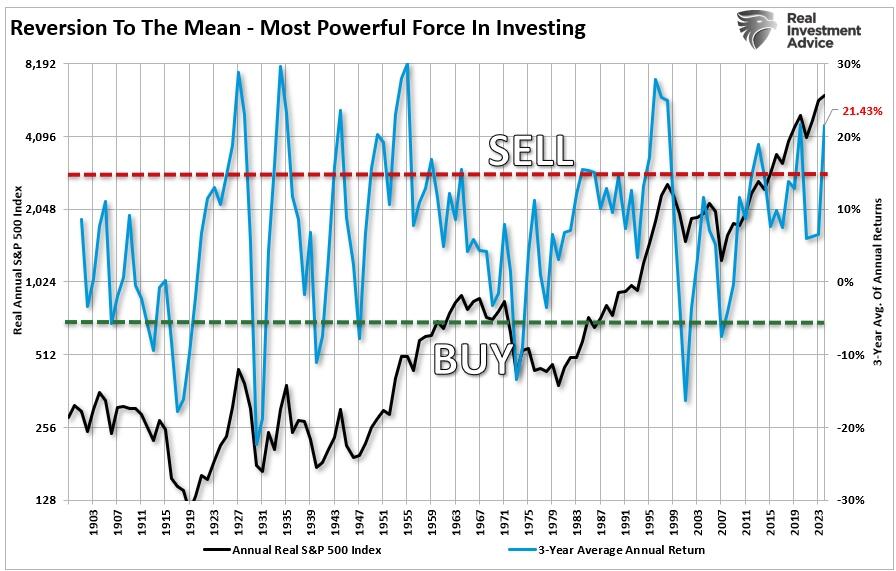
The chart below illustrates every economic expansion dating back to 1871, along with the subsequent market decline. (Note: the current bull market cycle that started in March 2020 is still running.)

This chart should make one point very clear – this cycle will end.
However, for now, there is little doubt that the bullish bias exists, as individuals continue to hold historically high levels of equity and leverage, chasing yield in the riskiest areas, and maintaining relatively low levels of cash, as shown in the charts below.

There are only a few people, besides me, who discuss the probabilities of lower returns over the next decade. But let’s do some basic math.
First, the consensus is that stocks will return:
-
10% each year in real (inflation-adjusted) terms,
-
plus or minus whatever changes we see in valuation ratios.
Plug in the math, and we get the following scenarios:
-
If the P/E10 declines from 40X to 19X over the next decade, equity returns should be roughly 3% per year in real terms or 5% nominal.
-
If the P/E10 declines to 15X, returns fall to 1% per year in real terms or 3% per year in nominal terms.
-
If the P/E10 remains at current levels, returns should be 8% per year in real terms or 10% per year in nominal terms.
The Problem With The Math
First, this assumes that stocks will continue to compound at a specific rate every year going forward. This is a common mistake that is made in return analysis. Equities do not compound at a stagnant rate of growth; instead, they experience a high degree of volatility over time.
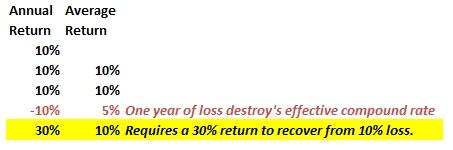
The ‘power of compounding’ ONLY WORKS when you do not lose money. As shown, after three consecutive years of 10% returns, a 10% drawdown cuts the average annual compound growth rate by 50%. Furthermore, it then requires a 30% return to regain the average rate of return required. In reality, chasing returns is much less critical to your long-term investment success than most believe.
As we discussed in “Bear Market Losses:”
“There is a significant difference between AVERAGE and ACTUAL returns. The impact of losses destroys the annualized “compounding” effect of money. To prove that, the purple shaded area shows the “average” return of 7% annually. However, the differential between the promised and “actual return” is the return gap. See the problem?”
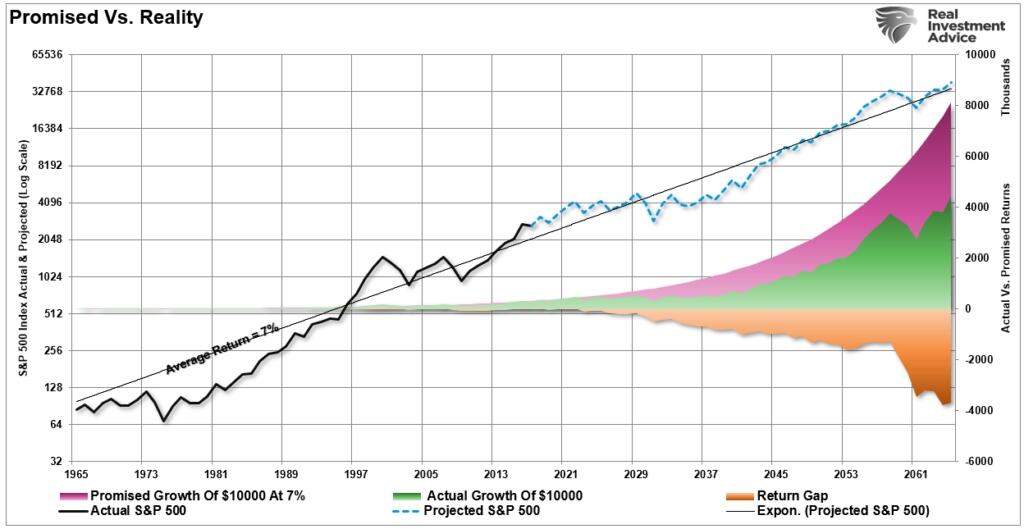
When imputing volatility into returns, the differential between what investors were promised (a massive flaw in financial planning) and what actually happened to their money is substantial over the long term.
The second point, and probably most important, is that YOU DIED long before you realized the long-term average rate of return.
The chart below compares the S&P 500 to annualized returns and the average of market returns since 1900. Over the last 125 years, the market has never produced a 10% return every single year; the average annual real return has been 7.33%.
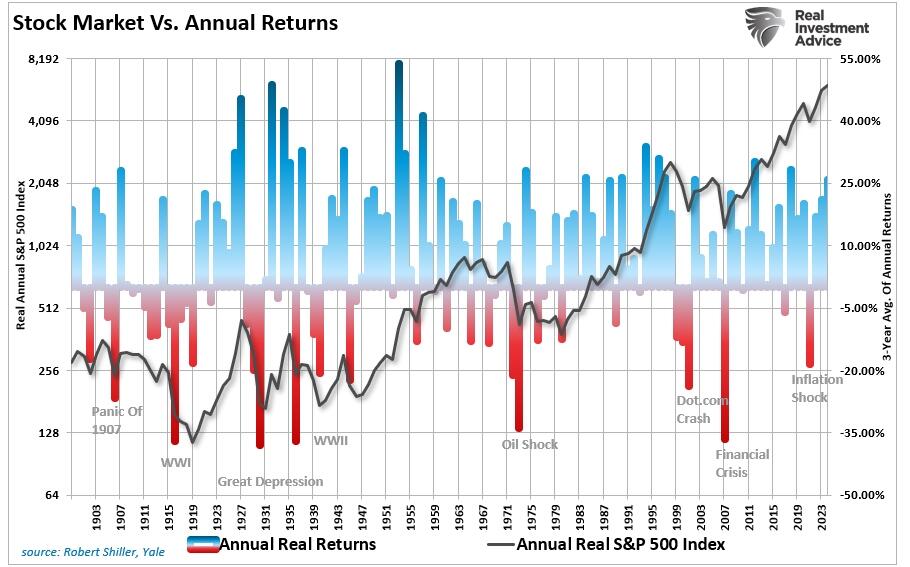
However, assuming that markets have a set return each year, as you could expect from a bond, is grossly flawed. While many years exceeded the predicted average of 10%, many did not. But then again, this is why 10% is the “average” and NOT the “rule.”
Secondly, and more importantly, the math on forward return expectations, given current valuation levels, does not hold up. The assumption that valuations can fall without the price of the markets being negatively impacted is also grossly flawed. Historical data, as illustrated in the following chart, suggest that valuations do not decline without a significant impact on investment returns. Additionally, it is worth noting that “full market cycles,” which encompass both secular bull and bear periods, recur throughout history.
Back To The Math
So, back to the “math” to prove this is true.
If we assume that, despite the weaker economic growth at present, the Federal Reserve is successful at getting nominal GDP back up to a historical growth rate of 6% annually. While this may not be realistic based on the data, when markets are near historical peaks, assumptions tend to run a bit wild. Unfortunately, such assumptions have often had rather unpleasant outcomes. But I digress.
Suppose we use a market capitalization-to-GDP ratio of 1.5 and an S&P 500 dividend yield of just 2%. What might we estimate for total returns over the coming decade using John Hussman’s formula?
(1.06)(0.6/1.5)^(1/10) – 1.0 + .02 = -1.2% annually.
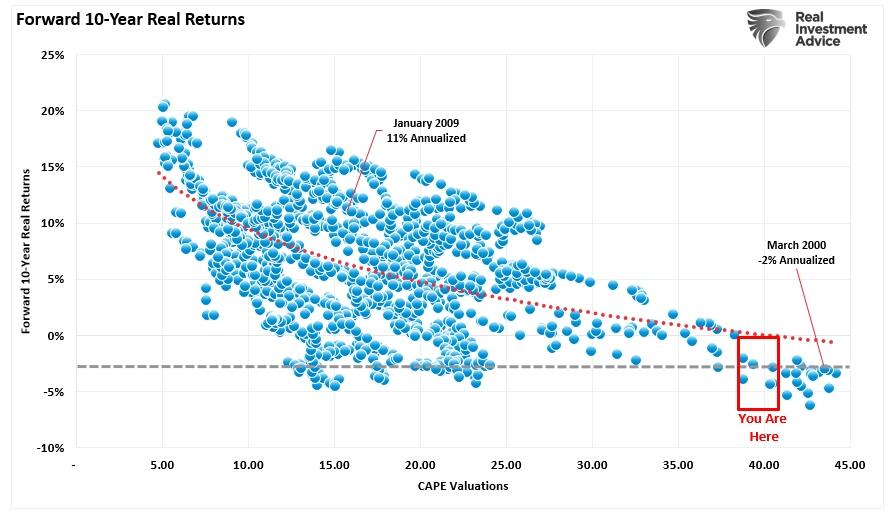
We can confirm that math by simply measuring the forward TOTAL return of stocks over the next 10 years from each annual valuation level.
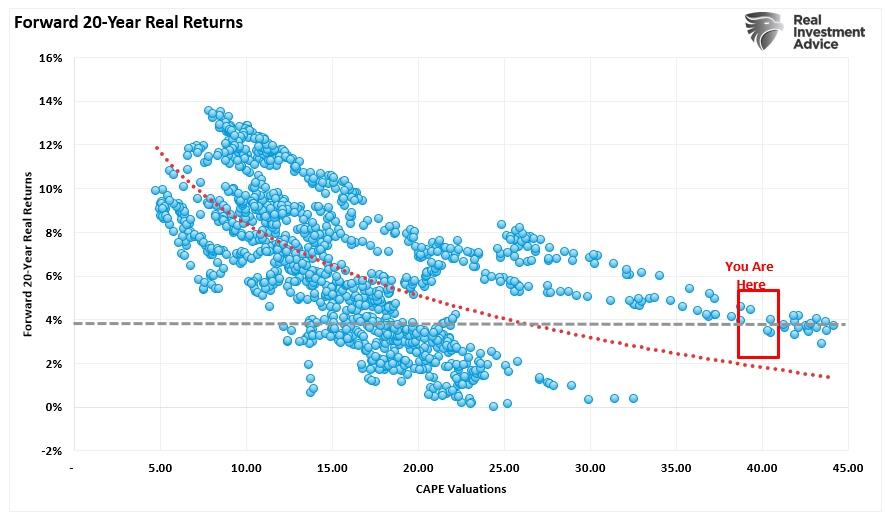
Forward 20-year returns do not improve significantly.
John Hussman once penned:
“Extraordinary long-term market returns come from somewhere. They originate in conditions of undervaluation, as in 1950 and 1982. Dismal long-term returns also come from somewhere – they originate in conditions of severe overvaluation. Today, as in 2000, and as in 2007, we are at a point where ‘this’ is like this. So ‘that’ can be expected to be like that.”
Nominal GDP growth is likely to be far weaker over the next decade. This will be due to structural changes in employment, rising productivity from Artificial Intelligence, suppressed real wage growth, still overly leveraged household balance sheets, reduced consumer capabilities, and declining demographic trends.
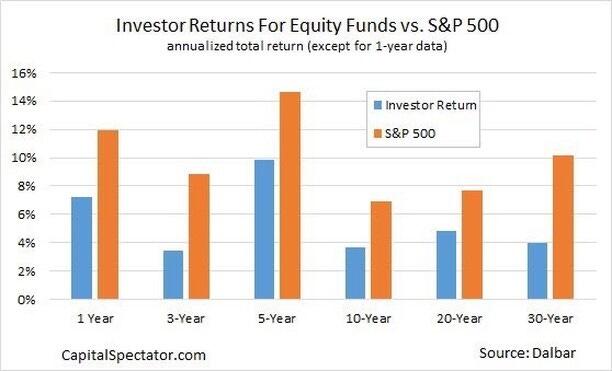
Most mainstream analyses make sweeping assumptions that are unlikely to materialize in the future. The market is highly volatile, which exacerbates the behavioral impact on forward returns to investors. The most recent Dalbar Study of investor behavior confirms this to be the case. Over the last 20 years, the S&P 500 has had an average annual return of 10%, while equity fund investors have seen a return of only 4.5%. (Read: Speculator or Investor)
So much for the 10% return assumptions in financial plans.
This has much to do with the simple fact that investors chase returns, buy high, sell low, and chase ethereal benchmarks. (Read “Benchmarking: 5 Reasons For Underperformance”) The reason that these emotional behaviors plague individuals is due to well-meaning articles espousing stock ownership at cyclical valuation peaks.
Halfway Through The Full Market Cycle
It is entirely possible that the current cyclical bull market is not over yet. As noted above, we are only in the first half of the current full market cycle, which began in 2009.
Momentum-driven markets are hard to kill in the latter stages, particularly as exuberance builds. However, they do eventually end. That is, unless the Fed has truly figured out a way to repeal economic and business cycles altogether. With economic growth slowing as the stimulus-fueled spurt reverses, we are likely closer to the next contraction than not. This is particularly the case as the Federal Reserve continues to build a bigger economic void in the future by pulling forward consumption through its monetary policies.
Will the market likely be higher in a decade? A case can certainly be made in that regard. However, suppose the economy experiences a normal recessionary cycle, or a credit-related event occurs, or the dreams of Artificial Intelligence fail to become reality, then things could be much more disappointing. As Seth Klarman from Baupost Capital once stated:
“Can we say when it will end? No. Can we say that it will end? Yes. And when it ends and the trend reverses, here is what we can say for sure. Few will be ready. Few will be prepared.”
We saw much of the same mainstream analysis at the peak of the markets in 1999, 2007, and 2020. New valuation metrics, IPO’s of negligible companies, SPACs, surging margin debt levels, options speculation, and valuation dismissals as “this time was different.” It was all a function of building exuberance, which was a common theme. Unfortunately, “this time is never different,” and the outcomes are always the same.
“History repeats itself all the time on Wall Street” – Edwin Lefevre
Tyler Durden
Mon, 11/10/2025 – 13:00ZeroHedge NewsRead More

 R1
R1
 T1
T1


