

EBITDA And The Warnings Of Charlie Munger
Authored by Lance Roberts via RealInvestmentAdvice.com,
This past week, Greg Feirman wrote an interesting article about “The Perils Of Adjusted EBITDA.” Before we get into his discussion, let’s discuss what EBITDA is.
EBITDA is an acronym that stands for “Earnings Before Interest, Taxes, Depreciation, and Amortization.” Over the years, EBITDA has become a go-to metric for evaluating corporate performance as it offers a simple way to assess a company’s profitability by removing non-cash charges and financing effects. However, the problem with EBITDA is that simplicity often comes at the cost of accuracy. Why do I say that? Because EBITDA ignores critical costs, such as depreciation, which can distort a company’s true economic picture in capital-intensive industries. When companies extend the lives of their assets to reduce depreciation expenses, EBITDA increases, even though the underlying cash outflows remain unchanged.
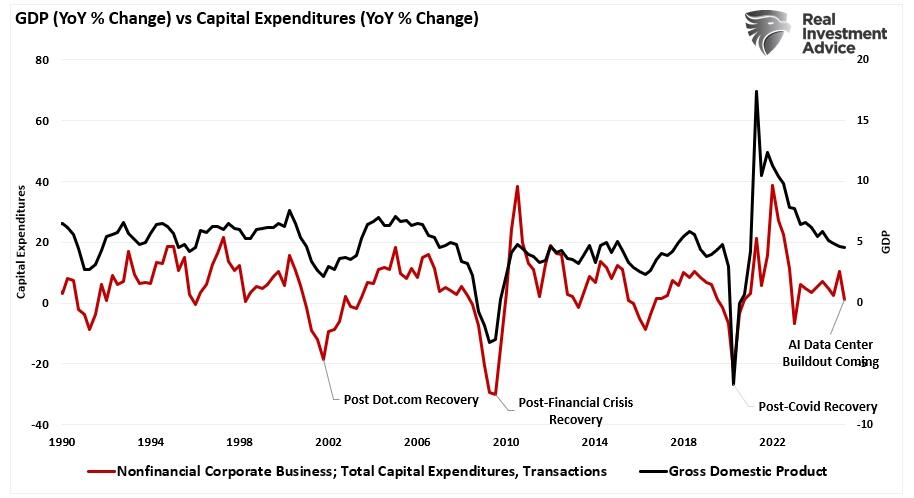
Read that last part again, because this is where Greg’s commentary hits home. Historically, capital expenditures tend to surge following recessions and economic downturns. This makes sense as companies expend capital to ramp up production as economic growth returns. You will notice a high correlation between economic and capital expenditures (CapEx) growth rates. Notably, this is particularly relevant in the AI sector, where firms are investing billions into chips, servers, and data centers, which will likely coincide with an increase in economic activity.
This is also where Greg’s comments are most relevant.
“On Monday morning, Michael Burry tweeted out more details about his AI Bubble thesis. He claims that the AI hyperscalers are “understating depreciation” by extending the period over which they are depreciating the Nvidia chips and all the other capital equipment they are buying to build out AI. This morning Jim Chanos applied the same logic to CoreWeave (CRWV). The first thing to understand is that Net Income is an accounting number. It is not the amount of cash that the company actually earns because it reflects certain approximations – one of the most important of which is depreciation.“
As Greg notes, a good example is CoreWeave (CRWV), which reported earnings this past week.
“Adjusted EBITDA more than doubled to $838 million from $379 million a year ago. On the surface, then, they are a profitable company – at least on this metric. But they backed out $630 billion in Depreciation and Amortization from their GAAP Net Loss of $110 million to arrive at that number. It’s only when we turn to the Cash Flow statement that we understand the how CoreWeave is financing their operations. Cash Flow from Operations in the first 9 months of 2025 was $1.5 billion. CapEx was $6.25 billion. Those are cash figures, not accounting ones. In other words, Free Cash Flow for the first nine months of the year was -$4.75 billion. That’s right: CRWV has burned up nearly $5 billion so far this year. How are they financing this? By selling debt. Essentially the whole difference is made up by their net debt issuance of ~$4.5 billion.”
This reveals the disconnect: EBITDA suggests “operating profitability looks good,” but the cash flow dynamics tell a very different story. If you rely only on EBITDA, you may miss the fact that the business is burning cash, depending on borrowing, or stretching asset lives unrealistically.
As Greg concluded:
“Clearly, the hyperscalers are spending an enormous amount of money on Nvidia chips and the other capital equipment required to build out AI. Their thesis is that the ROI on these investments over the long term will be excellent. If AI is truly the game changer many say it is, the returns may well outweigh any current concerns about the accounting. If not, a lot of this CapEx may be malinvestment and have to be written down in the future.
The overall point is that we are operating in the dark here because we don’t know the future returns on investment and we don’t know the appropriate rate to depreciate these huge Capital Expenditures to get the right Net Income numbers in the present.”
This is why investors need to be more realistic about understanding earnings reports and be cautious of the metrics they use to invest in companies. There are several pitfalls associated with EBITDA that you should be aware of. For example:
-
It ignores capital expenditures (CapEx) and replacement needs.
-
It omits changes in working capital—such as inventory, receivables, and payables—which can erode cash even when EBITDA is positive.
-
It may mask interest and debt burdens—two very real cash drains. Since interest is excluded, two companies with similar EBITDA may have vastly different risk profiles.
-
It allows for subjective “adjustments” (adjusted EBITDA) that reduce comparability across companies and time periods.
-
It may mislead in asset‑intensive sectors where hidden replacement or upgrade costs are large.
However, it isn’t just EBITDA, but earnings in general, that require closer inspection.
Earnings Aren’t What You Think
Just like the hit series “House of Cards,” Wall Street earnings season has become rife with manipulation, deceit, and obfuscation that could rival the dark corners of Washington, D.C. What is most fascinating is that so many individuals invest hard-earned capital based on these manipulated numbers. The failure to understand the “quality” of earnings, rather than the “quantity,” has always led to disappointing outcomes at some point in the future.
As Drew Bernstein recently penned for CFO.com:
“Non-GAAP financials are not audited and are most often disclosed through earnings press releases and investor presentations, rather than in the company’s annual report filed with the Securities and Exchange Commission.
Once upon a time, non-GAAP financials were used to isolate the impact of significant one-time events like a major restructuring or sizable acquisition. In recent years, they have become increasingly prevalent and prominent, used by both the shiniest new-economy IPO companies and the old-economy stalwarts.”
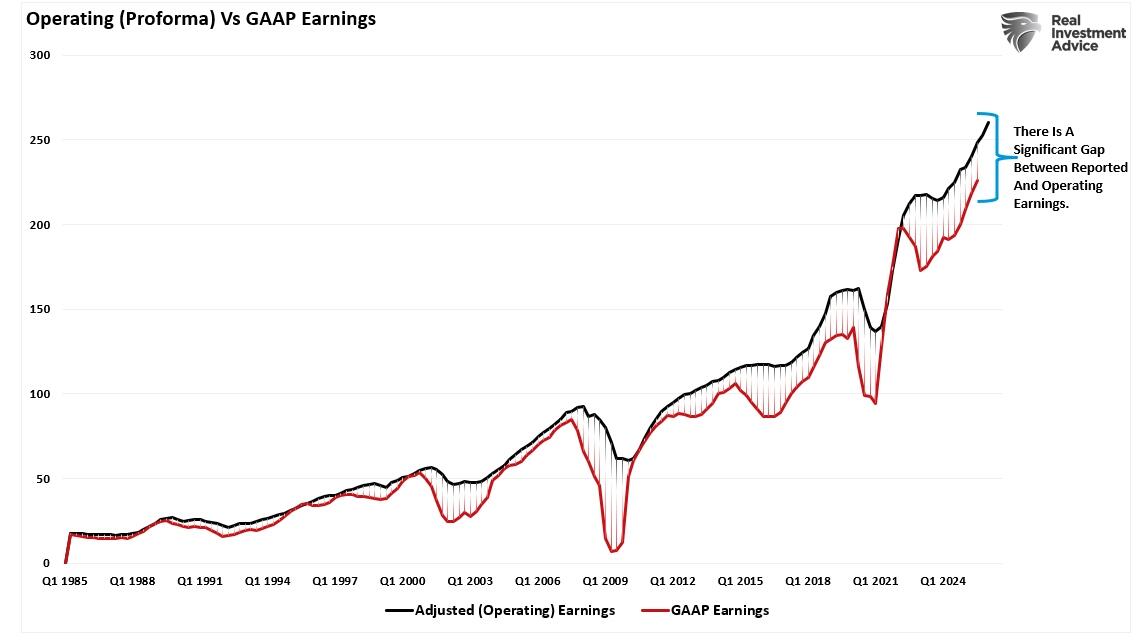
In the 1980s and early 1990s, companies typically reported GAAP earnings in their quarterly releases. If an investor dug through the report, they would find “adjusted” and “pro forma” earnings buried in the back. Today, GAAP earnings are buried in the back, hoping investors will miss the ugly truth.
These “adjusted or pro forma earnings” exclude items that a company deems “special, one-time, or extraordinary.” The problem is that these “special, one-time” items appear “every” quarter, leaving investors with a muddier picture of what companies are really making. This growing divergence between the earnings calculated according to accepted accounting principles and the “earnings” touted in press releases and analyst research reports has put investors at a disadvantage in understanding precisely what they are paying for.
As BofAML stated:
“We are increasingly concerned with the number of companies (non-commodity) reporting earnings on an adjusted basis versus those that are stressing GAAP accounting, and find the divergence a consequence of less earnings power.
Consider that when US GDP growth was averaging 3% (the 5 quarters September 2013 through September 2014) on average 80% of US HY companies reported earnings on an adjusted basis. Since September 2014, however, with US GDP averaging just 1.9%, over 87% of companies have reported on an adjusted basis. Perhaps even more telling, between the end of 2010 and 2013, the percentage of companies reporting adjusted EBITDA was relatively constant, and since 2013, the number has been on a steady rise.
So, why do companies regularly report these Non-GAAP earnings? Drew has the answer:
“When management is asked why they resort to non-GAAP reporting, the most common response is that these measures are requested by the analysts and are commonly used in earnings models employed to value the company. Indeed, sell-side analysts and funds with a long position in the stock may have incentives to encourage a more favorable alternative presentation of earnings results.”
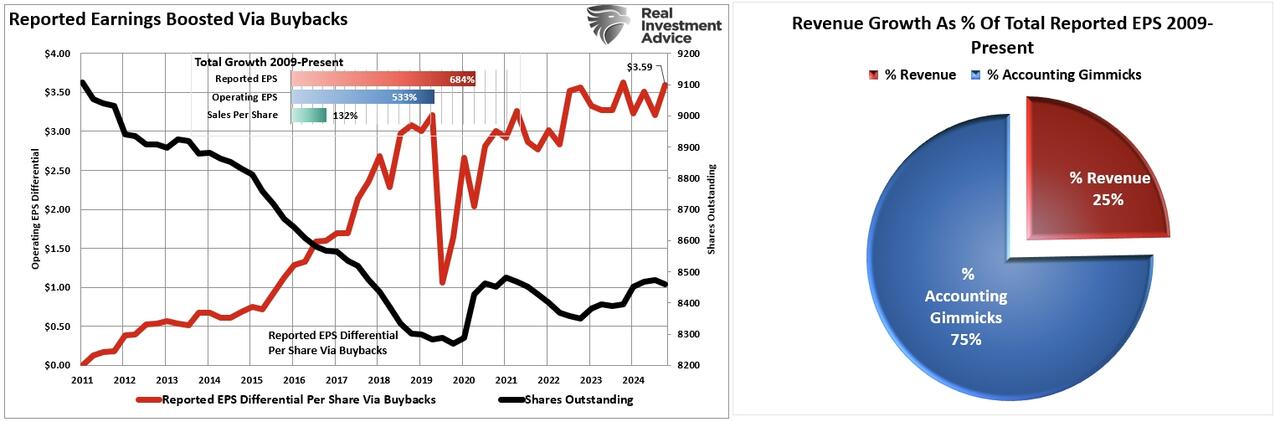
How much of a difference are we talking about? About $3.59/share in earnings, where revenue comprises only about 25% of the result.
But here is the real question:
“If non-GAAP reporting is used as a supplemental means to help investors identify underlying trends in the business, one might reasonably expect that both favorable and unfavorable events would be “adjusted” in equal measure.”
However, research presented by the American Accounting Association suggests that companies engage in “asymmetric” non-GAAP exclusions of mostly unfavorable items as a tool to “beat” analyst earnings estimates.
So, why has there been such a rise in all these accounting gimmicks? Money, of course.
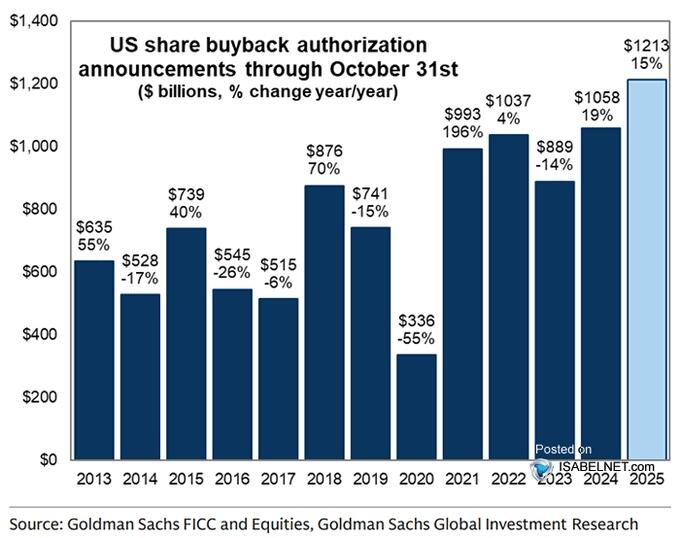
Better Earnings = Higher Stock Prices = Higher Compensation via Stock Buybacks
Why Munger Said “EBITDA is BullS***”
Wall Street is an insider system where the practice of legally manipulating earnings to create the best possible outcome and increase executive compensation has run amok. The adults in the room, a.k.a. the Securities & Exchange Commission, have “left the children in charge,” but will most assuredly leap into action to pass new regulations to rectify reckless misbehavior AFTER the next crash.
For investors, the manipulation of EBITDA and earnings not only skews valuation analysis but also specifically impacts any analysis involving earnings, such as P/E ratios, EV/EBITDA, and PEG.
Ramy Elitzur, via The Account Art Of War, expounded on the problems of using EBITDA.
“One of the things that I thought that I knew well was the importance of income-based metrics such as EBITDA, and that cash flow information is not as important. It turned out that common garden variety metrics, such as EBITDA, could be hazardous to your health.”
The article is worth reading and chock-full of good information; however, here are the four crucial points:
-
EBITDA is not a good surrogate for cash flow analysis because it assumes that all revenues are collected immediately and all expenses are paid immediately, leading to a false sense of liquidity.
-
Superficial common garden-variety accounting ratios will fail to detect signs of liquidity problems.
-
Direct cash flow statements provide a more detailed insight into the operating cash flows than indirect cash flow statements. Note that the vast majority (well over 90%) of public companies use the indirect format.
-
EBITDA, just like net income, is very sensitive to accounting manipulations.
The last point is the most critical. As Charlie Munger once stated:
“I think there are lots of troubles coming. There’s too much wretched excess. I don’t like when investment bankers talk about EBITDA, which I call bulls*** earnings. It’s ridiculous. EBITDA does not accurately reflect how much money a company makes, unlike traditional earnings. Think of the basic intellectual dishonesty that comes when you start talking about adjusted EBITDA. You’re almost announcing you’re a flake.”
In a world of adjusted earnings, where every company consistently outperforms its peers, investors often lose sight of what truly matters in investing.
“This unfortunate cycle will only be broken when the end-users of financial reporting — institutional investors, analysts, lenders, and the media — agree that we are on the verge of systemic failure in financial reporting. In the history of financial markets, such moments of mental clarity most often occur following the loss of vast sums of capital.” – American Accounting Association
Imaginary worlds are nice, but it’s just impossible to live there.
Where To Look Instead
So, if “operating earnings” and EBITDA are enough, where should you look? The answer is to focus on metrics that reflect real cash generation and sustainable operations. Free cash flow, which is operating cash flow minus capital expenditures, is one of the most important. It shows what’s left over after a business funds its maintenance and growth needs. A positive free cash flow tells you the company is generating more cash than it needs to sustain itself. A negative one warns that it’s living on borrowed money.
You should also examine trends in working capital, specifically, changes in receivables, payables, and inventory, to determine if the company is overextending itself to maintain operations. Asset lives and depreciation schedules should be realistic, not inflated to improve margins. Debt levels and interest costs matter too. EBITDA ignores both, but if a company’s cash flow can’t cover its debt service, that’s a red flag.
Here are the key metrics to prioritize over EBITDA:
- Free Cash Flow (operating cash flow minus CapEx)
- CapEx trends and whether they are delivering returns
- Depreciation policy and asset life assumptions
- Working capital changes in inventory, receivables, and payables
- Debt and interest obligations
- Reconciliation of EBITDA to net income and cash flow
When companies show a large gap between EBITDA and these real-world numbers, investors should be skeptical. In a capital-intensive sector like AI, where the future remains uncertain, the risks of relying on EBITDA are amplified. It may look clean on paper, but it can leave you blind to the business’s real financial health.
Tyler Durden
Mon, 11/17/2025 – 14:40ZeroHedge NewsRead More


 R1
R1
 T1
T1


