

Housing Market Winter Deepens As Delistings Soar To Eight-Year High
Building on our earlier housing-market note that “current conditions point to more persistent headwinds” across major metro areas, we now turn to new Redfin data showing a surge in delistings – a clear sign the market is slipping into year-end paralysis.
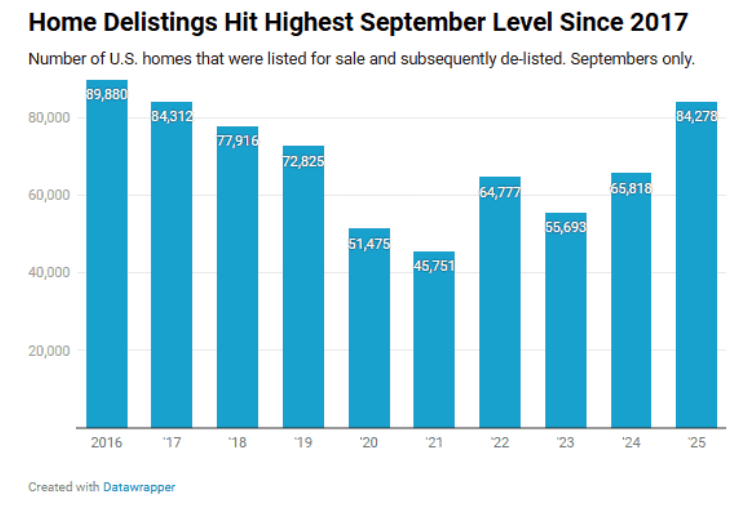
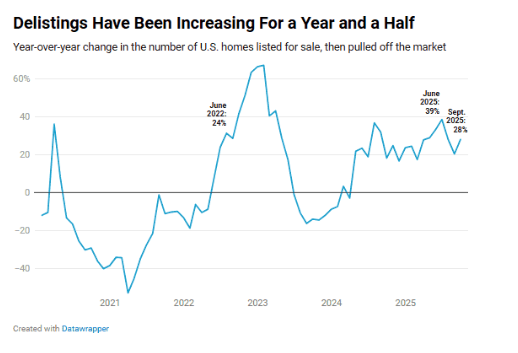
According to Redfin’s report, roughly 85,000 U.S. homes were pulled off the market in September – a 28% jump from last year and the highest September total in eight years. Redfin classifies a home as delisted when it’s removed for more than 31 days without selling.
Redfin points to a set of underlying market dynamics fueling the rapid rise in delistings:
-
Stale listings dominate: 70% of all listings in September had been on the market 60+ days. The median delisted home sat 100 days before being pulled. Markets remain oversupplied, with roughly 500,000 more sellers than buyers.
-
Demand is very weak: High rates, high prices, and broad economic uncertainty are sidelining buyers.
-
Sellers refuse to take losses: 15% of delisted homes were at risk of selling at a loss—the highest in five years—leading many owners to withdraw rather than accept lower bids.
-
Turn to renting: Many would-be sellers prefer to rent out the property and wait for better conditions.
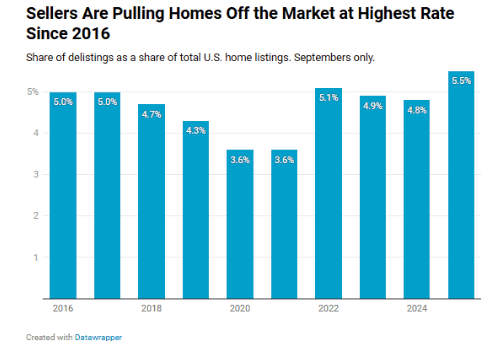
Delistings accounted for 5.5% of all September transactions (vs. 4.8% a year earlier), the highest share for that month since tracking began in 2016.
Redfin economists say the jump is more serious than it appears because sellers “give up” after long periods without offers.
“That increase is bigger than it looks on paper; it represents a fairly significant jump in delistings from last year,” Redfin senior economist Asad Khan stated, adding, “More sellers are giving up because their homes have been sitting on the market for a long time, and they don’t want to or can’t afford to settle on accepting a low price.”
Redfin data showed that 20% of the homes delisted in summer were relisted within three months – this is typically a pricing reset tactic and also to show up on the top feeds of popular online real estate marketplaces.
Wonder how many of those are Airbnbs?
On a geographic basis, these are the metros experiencing the most delistings in September:
-
Virginia Beach +74.5%
-
Washington, D.C. +53.9%
-
San Jose +53.3%
-
Dallas +52.1%
-
Houston +49.6%
Highest delisting share of all listings:
-
Miami 7.8%
-
Fort Lauderdale 7.7%
-
Dallas 7.5%
-
Philadelphia 7.5%
-
West Palm Beach 7.5%
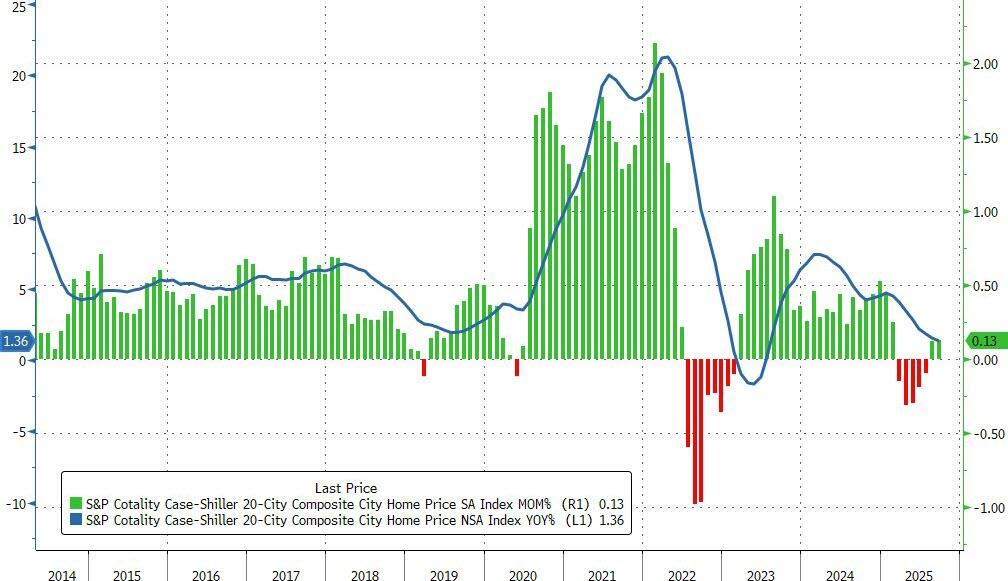
The latest Case-Shiller data shows U.S. home prices in the 20 largest cities rose 0.13% MoM in September (very slightly better than the 0.1% rise expected) and are up for the second month in a row (after falling for five straight months before). This MoM rise left the average prices up just 1.36% YoY – the lowest since July 2023…
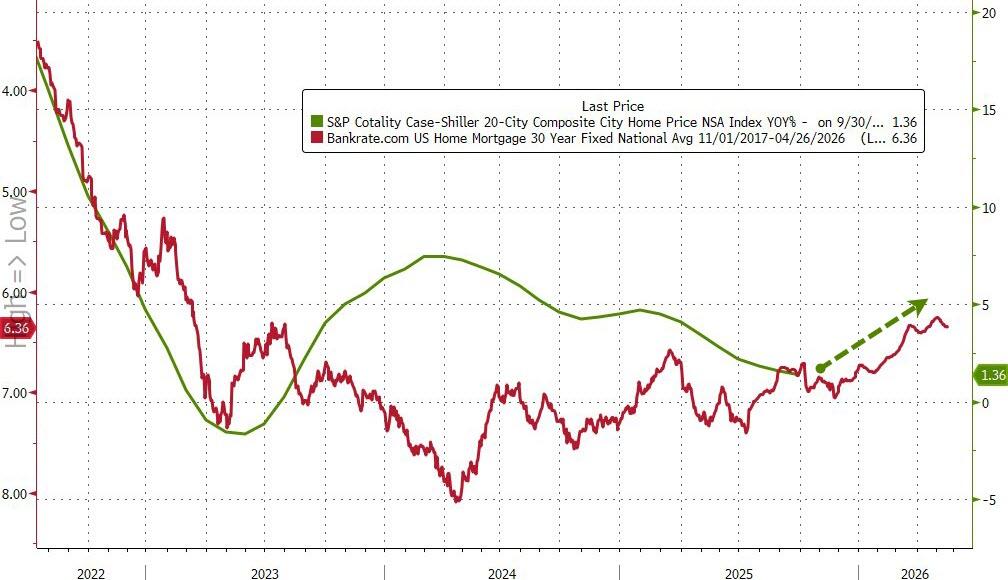
Declining mortgage rates suggest a looming rebound in aggregate prices…
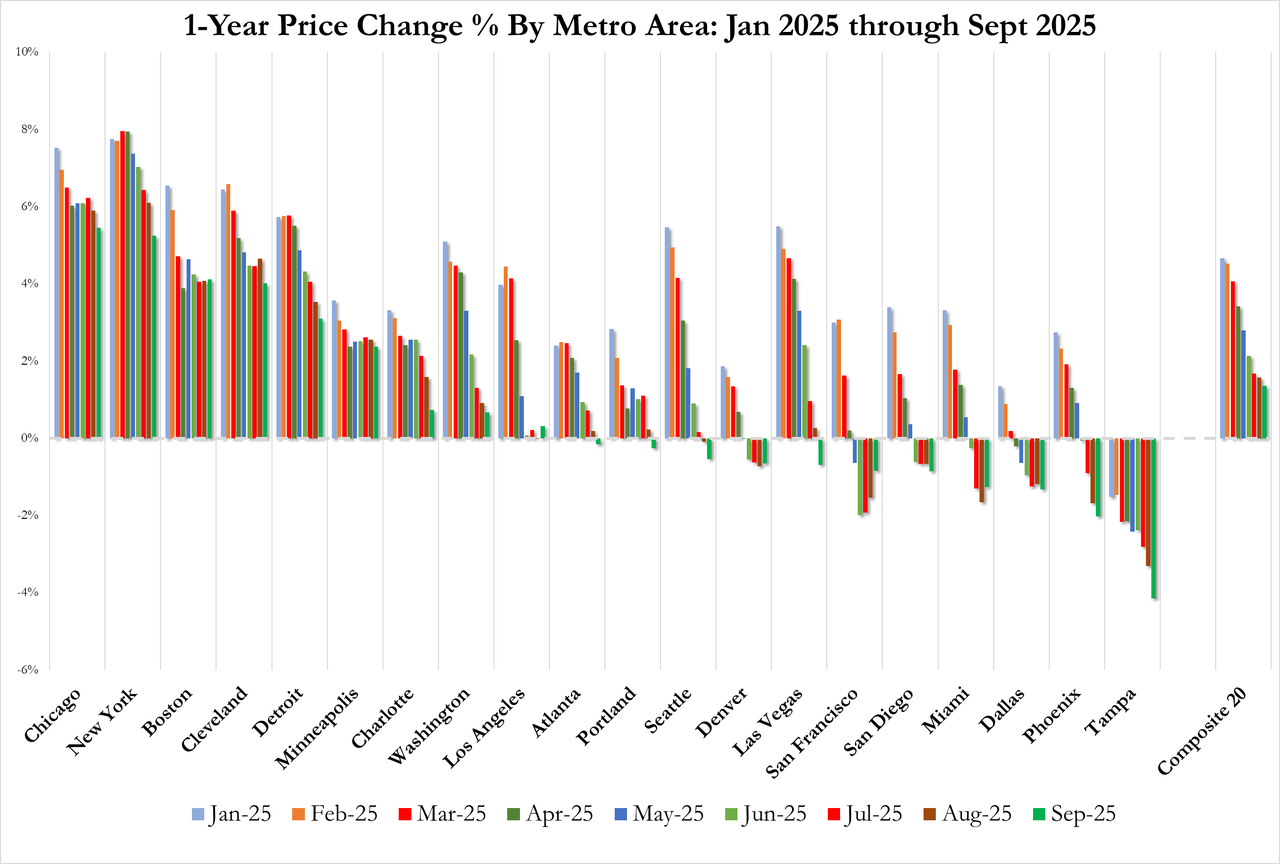
Home Prices are now falling (YoY) in a majority (11/20) of America’s largest cities…
Additionally, new listings remain stagnant because many homeowners are opting not to list. That’s because they’re locked in ultra-low mortgage rates (2020–2022) and won’t give them up unless they get a premium.
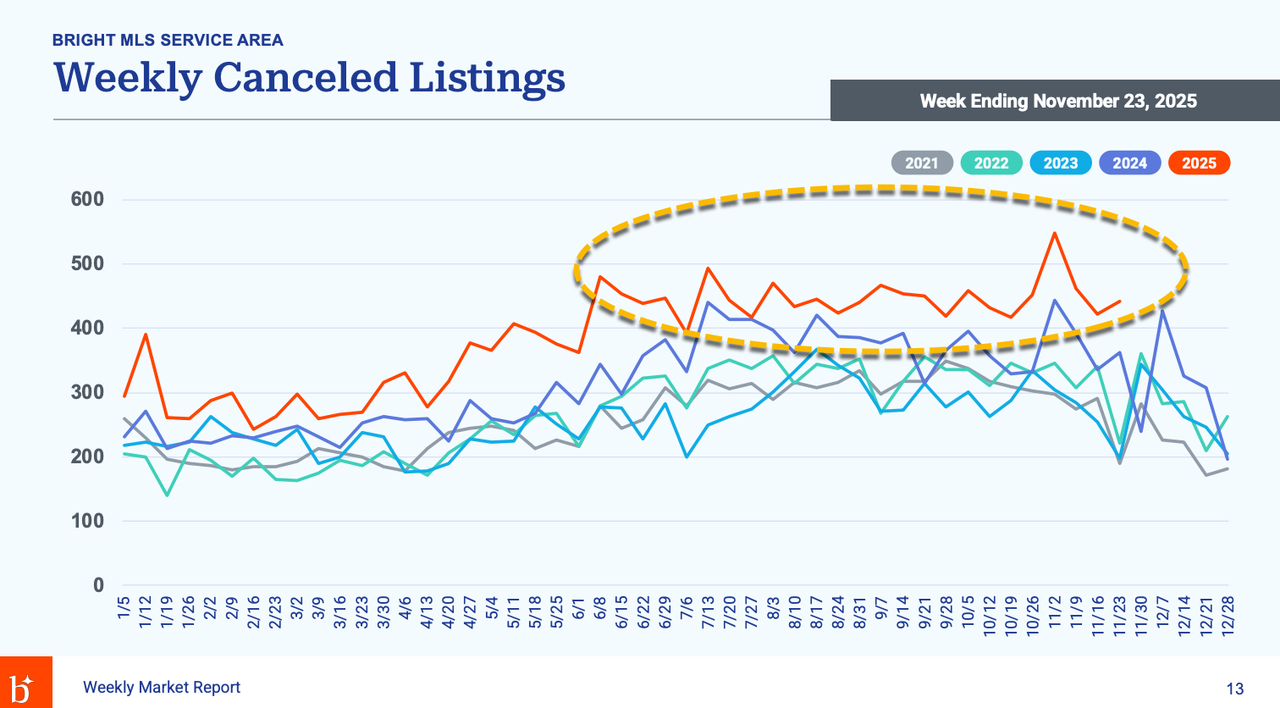
The latest weekly data from Bright MLS shows cancellations running at above-trend levels across its Mid-Atlantic coverage area.
Translation: housing-market paralysis has deepened, which is why President Trump proposed a 50-year mortgage to break the ice.
Tyler Durden
Tue, 11/25/2025 – 16:40ZeroHedge NewsRead More


 R1
R1
 T1
T1


