
What The Top 1% Richest Americans Pay In Taxes Across The US
This graphic, via Visual Capitalist’s Bruno Venditti, uses IRS data from 2022 analyzed by SmartAsset to show how much the richest people contribute to income tax revenue.
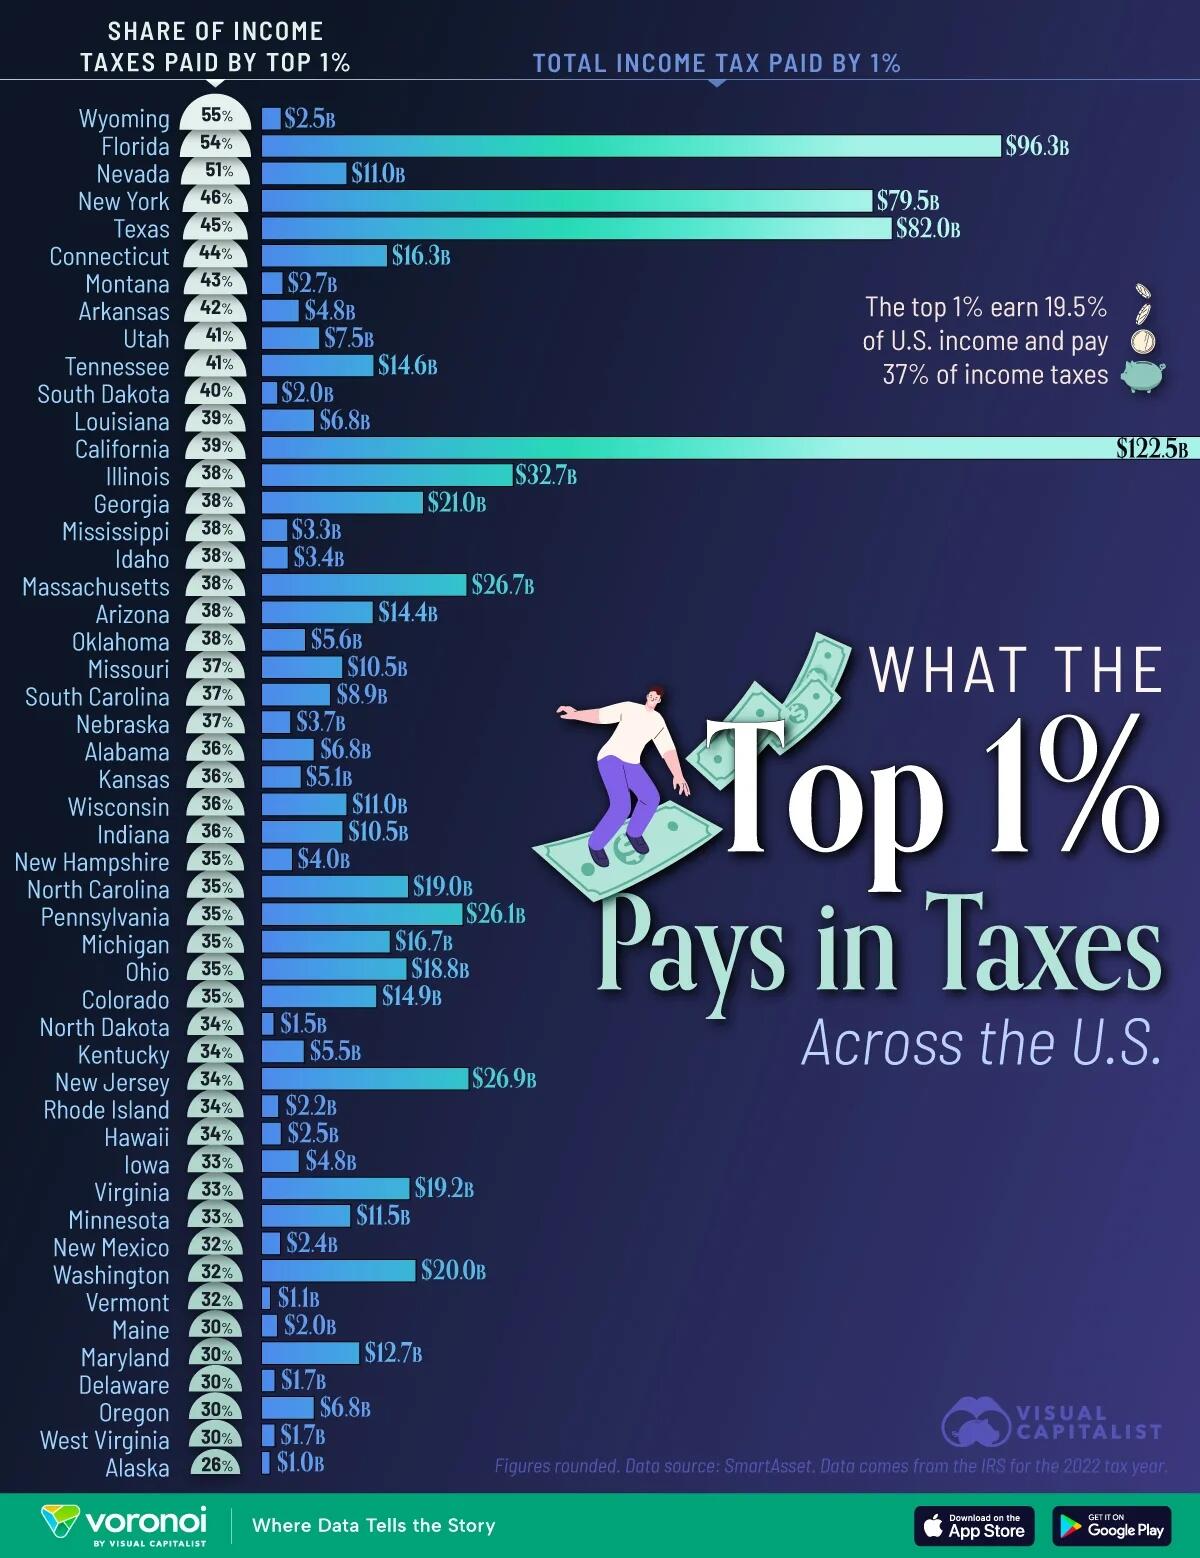
Where the Top 1% Pay the Largest Share of Taxes
The table below includes each state’s share of income taxes paid by the top 1% and the total amount of income tax they paid.
Wyoming leads the nation, with the top 1% paying 54.67% of all state income taxes.
Florida and Nevada follow closely, both surpassing the 50% threshold.
These states attract high-income individuals in part due to tax-friendly policies and large concentrations of wealthy households.
| Rank | State | Income taxes paid by top 1% | Total income tax paid by 1% (thousands of dollars) |
|---|---|---|---|
| 1 | Wyoming | 54.67% | $2,460,940 |
| 2 | Florida | 53.62% | $96,264,565 |
| 3 | Nevada | 51.12% | $11,010,104 |
| 4 | New York | 46.26% | $79,488,609 |
| 5 | Texas | 44.52% | $81,990,700 |
| 6 | Connecticut | 43.85% | $16,284,881 |
| 7 | Montana | 42.92% | $2,690,156 |
| 8 | Arkansas | 42.22% | $4,814,153 |
| 9 | Utah | 41.16% | $7,477,634 |
| 10 | Tennessee | 41.04% | $14,547,566 |
| 11 | South Dakota | 40.46% | $2,020,508 |
| 12 | Louisiana | 38.72% | $6,806,423 |
| 13 | California | 38.60% | $122,452,981 |
| 14 | Illinois | 38.39% | $32,677,874 |
| 15 | Georgia | 38.31% | $21,001,340 |
| 16 | Mississippi | 38.29% | $3,297,109 |
| 17 | Idaho | 38.20% | $3,392,957 |
| 18 | Massachusetts | 38.19% | $26,646,912 |
| 19 | Arizona | 38.00% | $14,438,918 |
| 20 | Oklahoma | 37.80% | $5,622,529 |
| 21 | Missouri | 37.16% | $10,481,163 |
| 22 | South Carolina | 37.05% | $8,867,845 |
| 23 | Nebraska | 37.03% | $3,704,671 |
| 24 | Alabama | 36.15% | $6,778,809 |
| 25 | Kansas | 35.79% | $5,066,051 |
| 26 | Wisconsin | 35.54% | $11,024,109 |
| 27 | Indiana | 35.52% | $10,518,818 |
| 28 | New Hampshire | 35.41% | $3,946,877 |
| 29 | North Carolina | 35.28% | $19,037,365 |
| 30 | Pennsylvania | 35.09% | $26,128,752 |
| 31 | Michigan | 35.01% | $16,650,121 |
| 32 | Ohio | 34.60% | $18,842,538 |
| 33 | Colorado | 34.51% | $14,894,687 |
| 34 | North Dakota | 34.41% | $1,521,767 |
| 35 | Kentucky | 34.26% | $5,451,182 |
| 36 | New Jersey | 33.78% | $26,899,308 |
| 37 | Rhode Island | 33.58% | $2,150,700 |
| 38 | Hawaii | 33.57% | $2,455,554 |
| 39 | Iowa | 33.16% | $4,813,252 |
| 40 | Virginia | 32.94% | $19,239,261 |
| 41 | Minnesota | 32.64% | $11,524,941 |
| 42 | New Mexico | 32.30% | $2,380,544 |
| 43 | Washington | 32.06% | $20,012,467 |
| 44 | Vermont | 32.04% | $1,078,255 |
| 45 | Maine | 30.48% | $1,976,671 |
| 46 | Maryland | 30.45% | $12,675,749 |
| 47 | Delaware | 30.38% | $1,647,326 |
| 48 | Oregon | 30.37% | $6,773,041 |
| 49 | West Virginia | 30.28% | $1,647,747 |
| 50 | Alaska | 26.37% | $1,016,945 |
High-Population States with High-Dollar Contributions
In states like California, Texas, and New York, the share of taxes paid by the top 1% ranges from 39% to 46%, but the dollar amounts are higher due to population scale.
California’s top earners alone account for more than $122 billion in income taxes, the largest total contribution of any state.
High adjusted gross incomes—often above $2 million—mean that even moderate tax-share percentages translate into substantial revenue.
States with More Evenly Distributed Tax Burdens
States further down the ranking, such as Oklahoma, Arizona, and Idaho, still see the top 1% paying about 38% of income taxes.
Alaska sits at the bottom, with top earners paying 26%.
Across nearly every state, the top 1% shoulder between one-third and one-half of total income taxes.
If you enjoyed today’s post, check out Mean vs. Median: Visualizing Net Worth in the U.S. by Age Group on Voronoi, the new app from Visual Capitalist.
Tyler Durden
Fri, 12/12/2025 – 19:40ZeroHedge NewsRead More


 R1
R1
 T1
T1


