

Visualizing The Growing Gap Between US Home Size And Price
Each year, new single-family homes continue to shrink further.
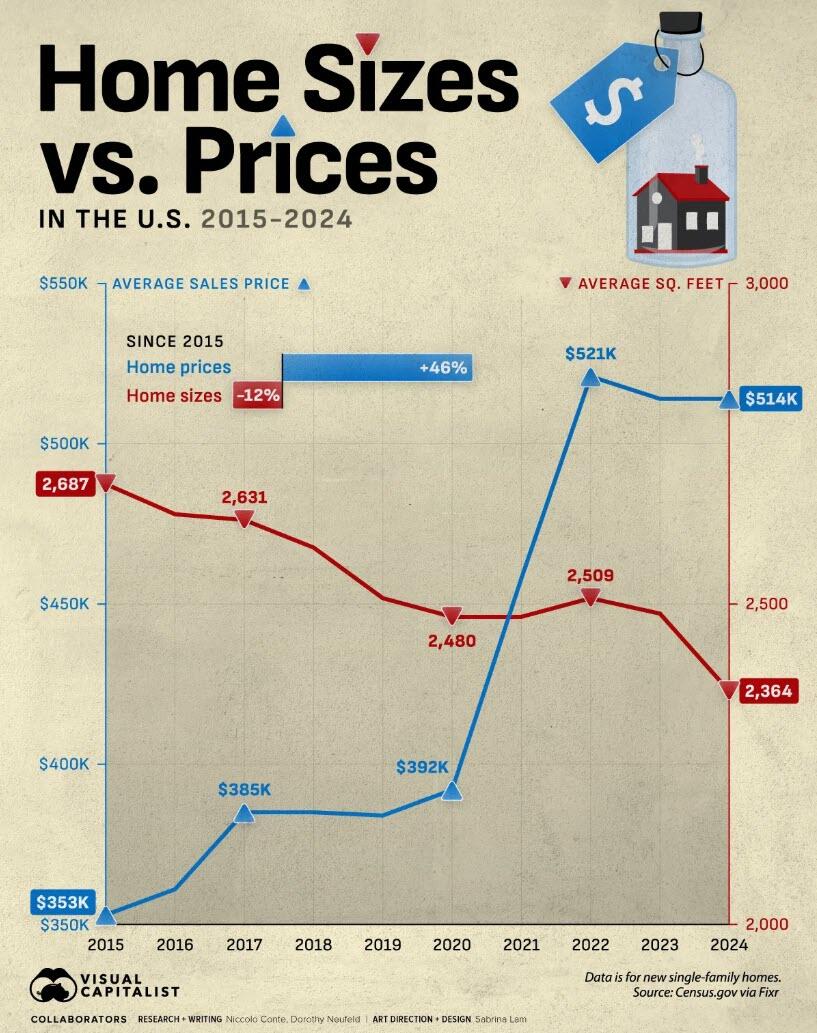
With the exception of 2022 and 2023, the average square footage of new homes has declined since 2015. In contrast, home prices have jumped 46% over the decade, averaging $514,000 in 2024 due to strong housing demand.
This graphic, via Visual Capitalist’s Dorothy Neufeld, shows the typical size versus the average cost of a new home since 2015, based on data from the U.S. Census Bureau via Fixr.
Shrinkflation and the Average Cost of a New Home
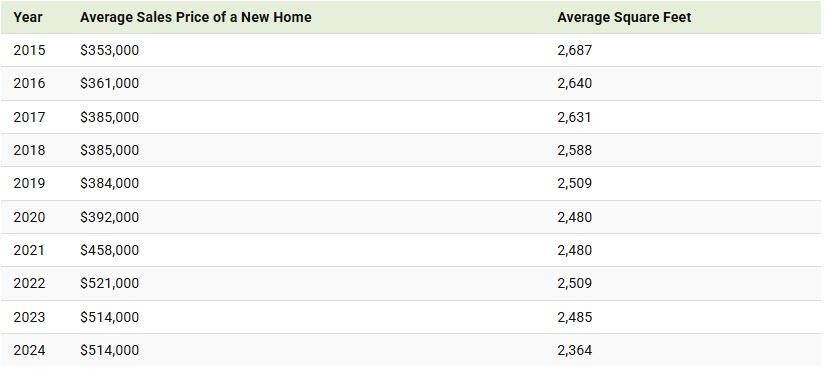
Below, we compare the average square footage of a single-family home in America to sales prices in the last decade:
Since 2015, the average home size has shrunk by 323 square feet, with even sharper decreases in the South, at 374 square feet.
Meanwhile, prices are $161,000 higher than 10 years ago. Even though average 30-year fixed mortgage rates sit around 6.5–7%—up from 2.7% in 2020—prices remain elevated.
Along with a higher cost of capital, the prices of land, labor, and raw materials have increased meaningfully, further driving up costs. Overall, construction costs account for almost two-thirds of the sales price.
More recent data shows that new-home buyers are at record lows in America, representing just 21% of the total market. Meanwhile, the average age of first-time buyers is at an all-time high of 40. For perspective, first-time homebuyers have made up 38% of all buyers, on average, for about four decades.
To learn more about this topic, check out this graphic on rent and home price changes across major global cities since 2015.
Tyler Durden
Mon, 12/29/2025 – 20:30ZeroHedge NewsRead More


 R1
R1
 T1
T1


