Affordability Across North America")
Mapping Housing (Un)Affordability Across North America
Many cities are seeing a widening gap between wages and home prices, making them “impossibly unaffordable.”
Not only that, U.S. home prices are more unaffordable than the run up to the 2008 global financial crisis. Driving this affordability crunch is the combination of elevated interest rates and soaring home prices in the post-pandemic boom, although some markets have seen slowing growth in recent months.
This graphic, via Visual Capitalist’s Dorothy Neufeld, shows housing market affordability in North America, based on data from the Globe and Mail via Hanif Bayat.
The Housing Affordability Crunch in 2025
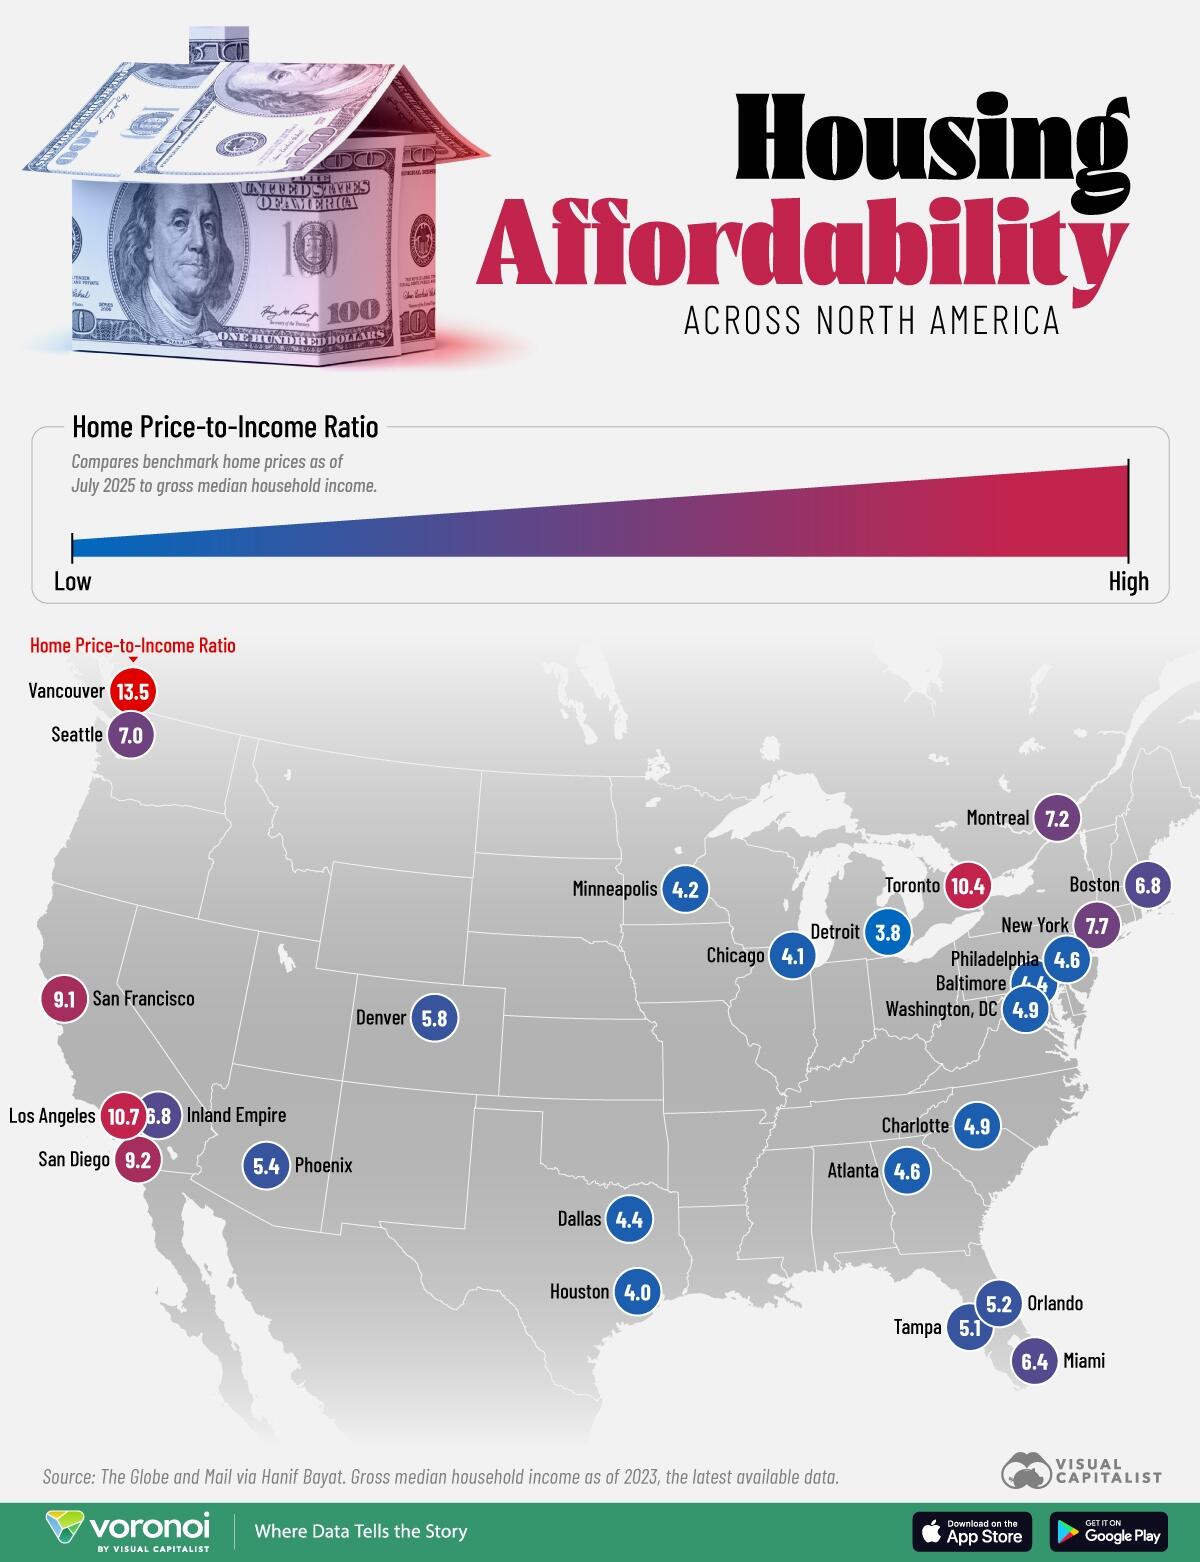
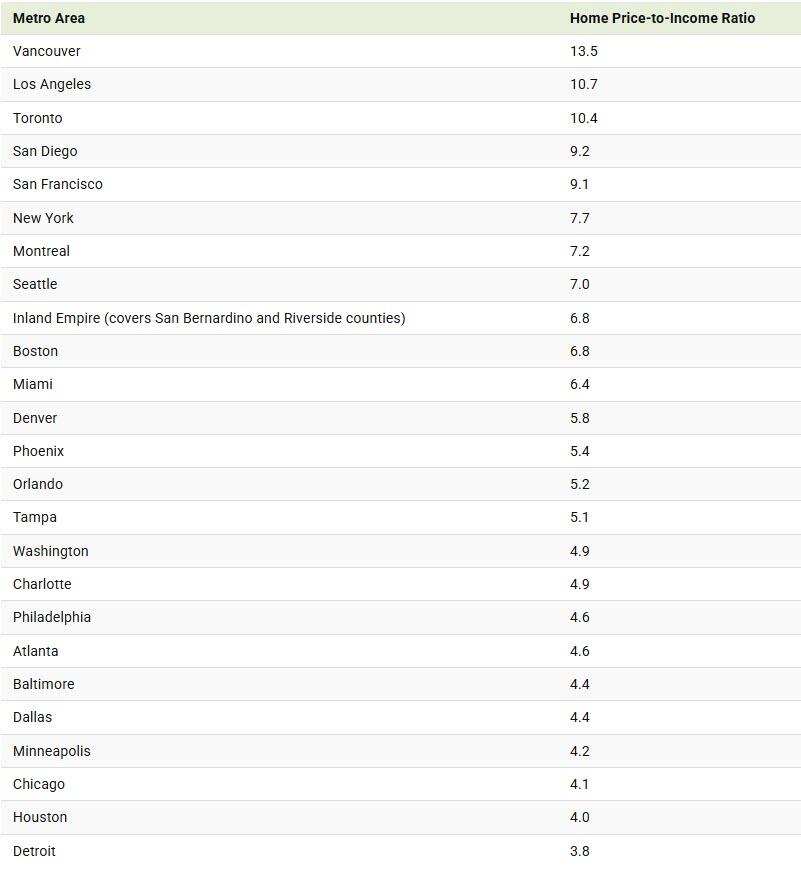
Below, we compare benchmark home prices as of July 2025 to gross median household income across major metro areas in North America:
Gross median household income as of 2023, the latest data available.
With a home price-to-income ratio of 13.5, Vancouver, Canada’s housing market is extremely out of reach for most residents.
Today, it surpasses all other major American cities, where the average price for a detached home often exceeds $1.4 million–up from around $250,000 in 2000. Similarly, home prices in Toronto are more than 10 times higher than the median household income.
Meanwhile, the West Coast metros of Los Angeles, San Diego, and San Francisco are the most unaffordable in the U.S. given high demand, supply shortages, and for the latter, proximity to Silicon Valley.
Falling near the middle of the pack is Miami, where home prices are 6.4 times the median household income. While home prices have fallen moderately over the past year, they have jumped 61% higher since July 2020—increasing affordability concerns.
To learn more about this topic, check out this graphic on the world’s most unaffordable housing markets.
Tyler Durden
Sat, 09/20/2025 – 08:45ZeroHedge NewsRead More