Fed’s Favorite Inflation Indicator Shows No Sign Of Runaway Tariff Costs, As Savings Rate Slides
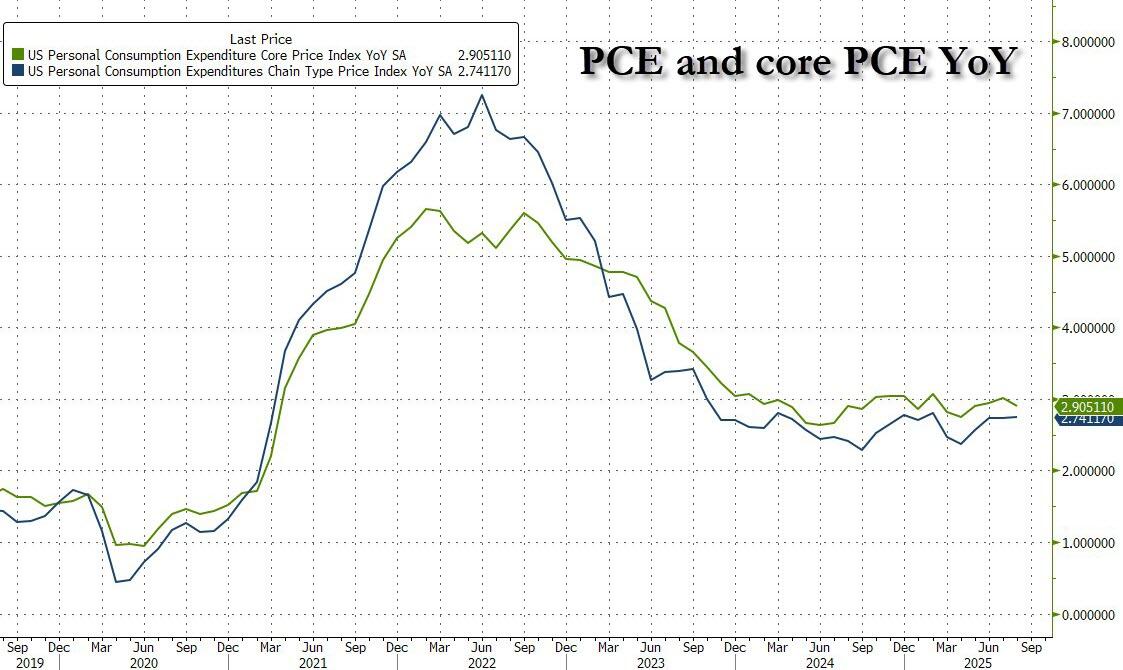
After a modest increase two months ago, and a steady print in July, analysts expected headline PCE to be steady at +2.6% YoY in August and Core PCE – the Fed’s favorite indicator – to also be unchanged at 2.9% YoY… and the numbers all came in right in line with expectations.
Indeed, “as expected” is the them of this morning’s data with headline and Core PCE both matching expectations and staying in the same range they have been in for two years… not exactly the Trump Tariff terror future that every “respected” economist predicted.
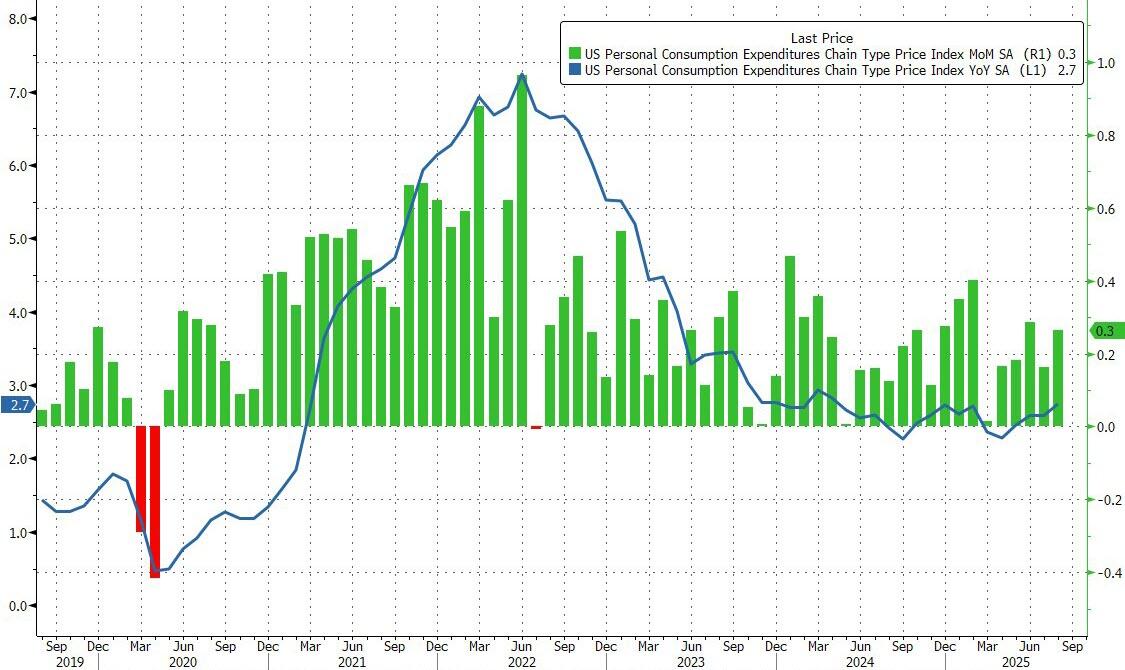
- PCE 0.3% MoM, Exp. 0.3%, in line
- PCE 2.7% YoY, Exp. 2.7%, in line
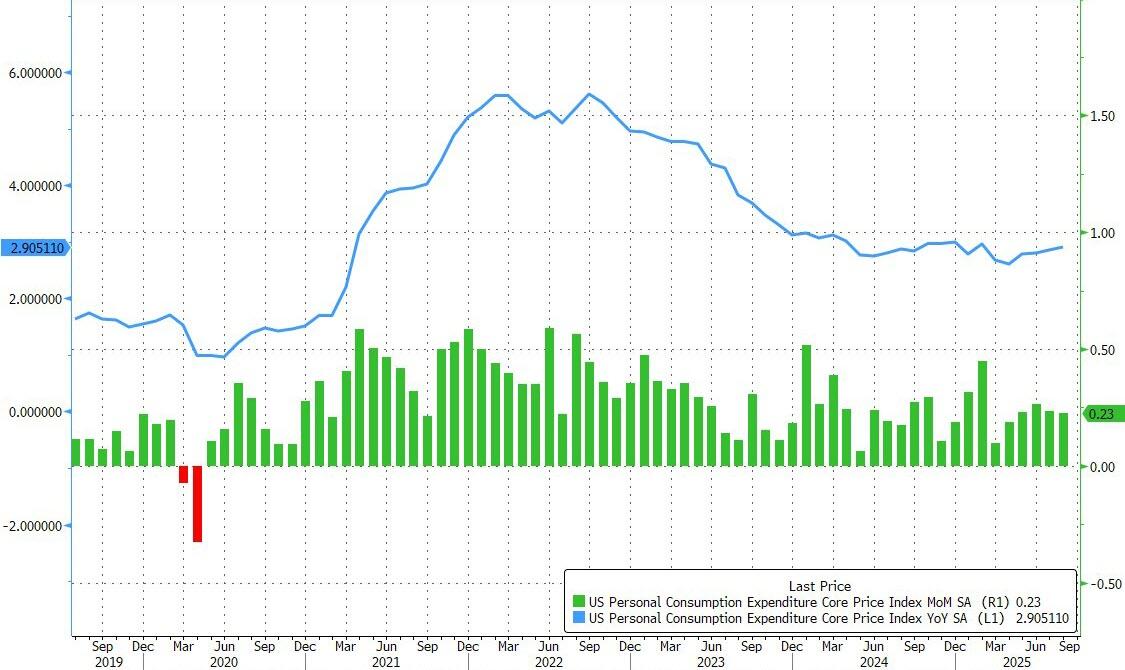
- PCE Core 0.2% MoM, Exp. 0.2%, in line
- PCE Core 2.9% YoY, Exp. 2.9%, in line
On an annual basis headline PCE was flat at 2.741%, while core PCE actually dipped modestly to 2.905 in August.
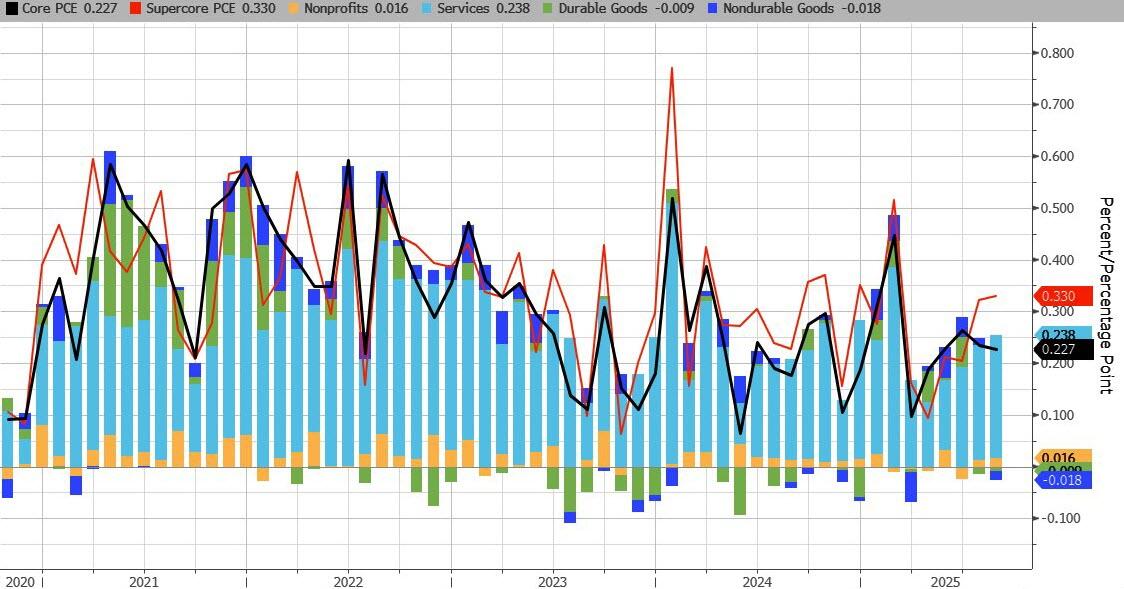
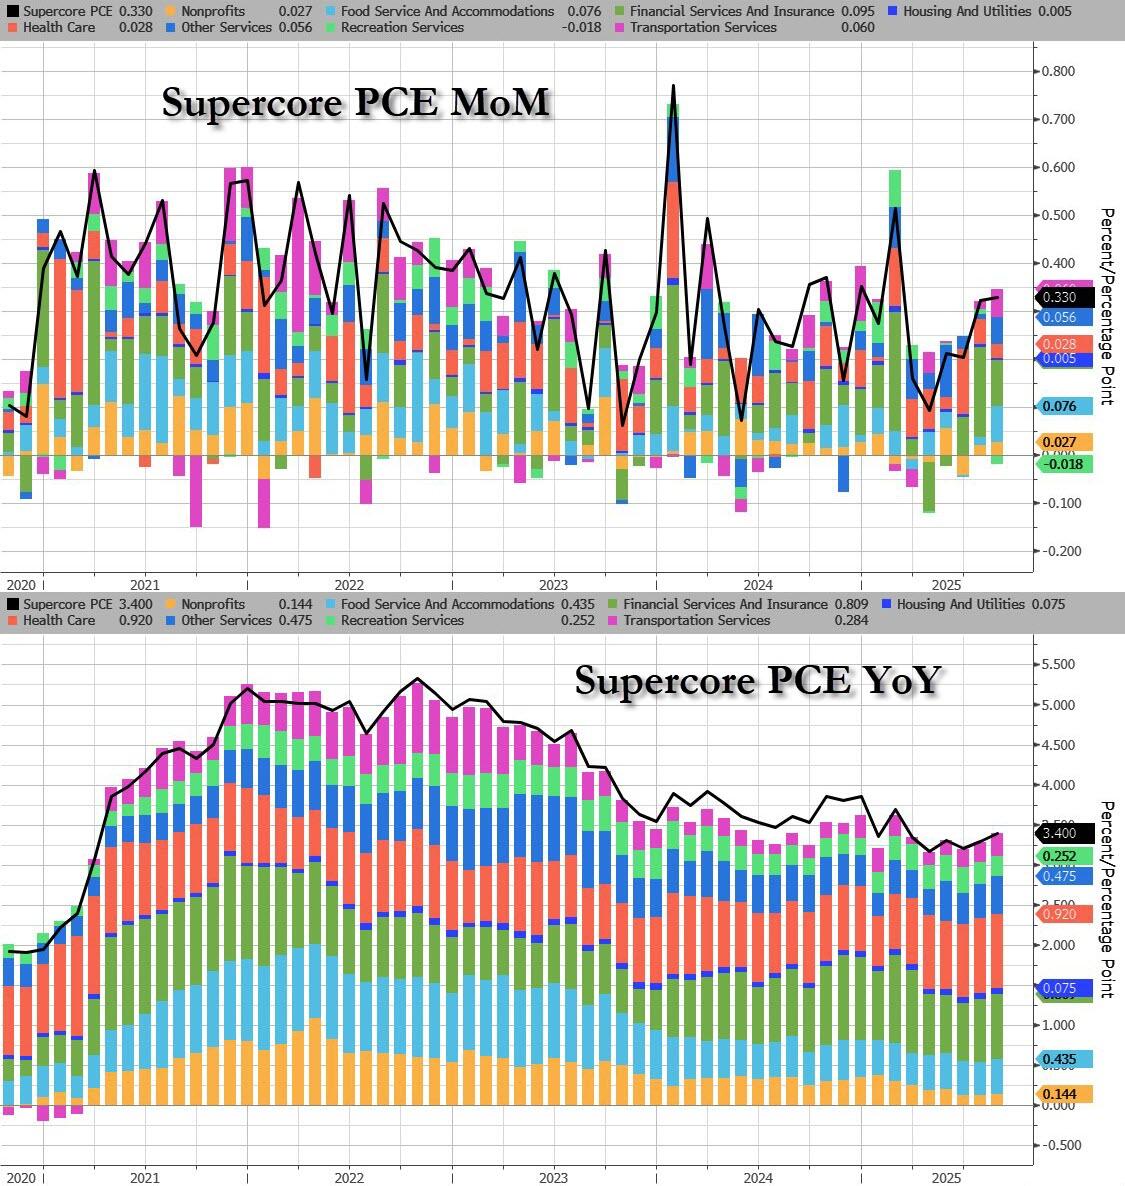
All those expecting a bounce in Durable Goods inflation will have to wait another month: in August it actually declined again, as did Nondurable Goods, while Services costs increased the most.
Headline PCE rose 0.2% MoM (as expected) and +2.6% YoY (as expected)…
Core PCE rose 0.3% MoM (as expected) and +2.9% YoY (as expected)…
For the second month in a row, Financial Services costs (i.e., soaring stock market and associated services) dominated SuperCore prices (and certainly have nothing to do with tariffs at all). Food services and transportation costs also boosted Supercore.
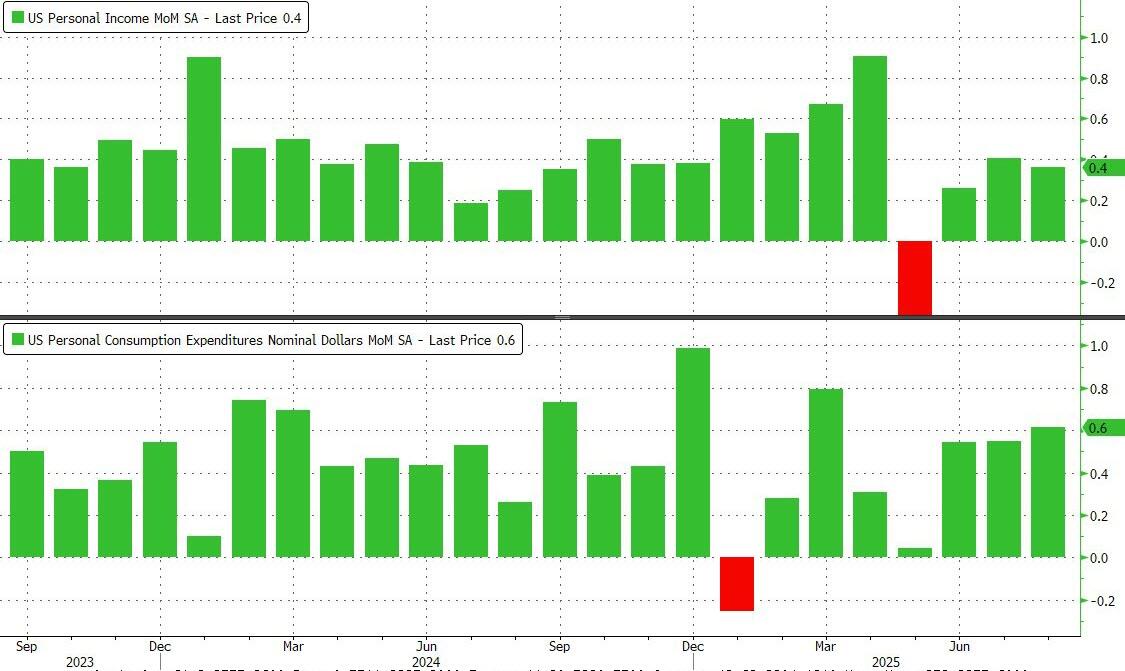
While prices are rising but in their recent normal range, income and spending both came in a fraction hotter than expected, up 0.4% MoM (above exp. 0.3%) and 0.6% MoM (above exp. 0.5%) respectively…
Developing
Tyler Durden
Fri, 09/26/2025 – 09:04ZeroHedge NewsRead More