Where Americans Can’t Afford Healthcare
If there are two issues that dominate America’s online discourse, they’re the soaring cost of housing and the even steeper price of staying healthy.
The U.S. pours almost $13,000 per person into healthcare, yet average life expectancy is below nearly every other high-income nation.
It’s a study of contrasts.
As Visual Capitalist’s Pallavi Rao notes, the country boasts of state of the art facilities and cutting edge research, while nearly 10% of Americans can’t afford healthcare.
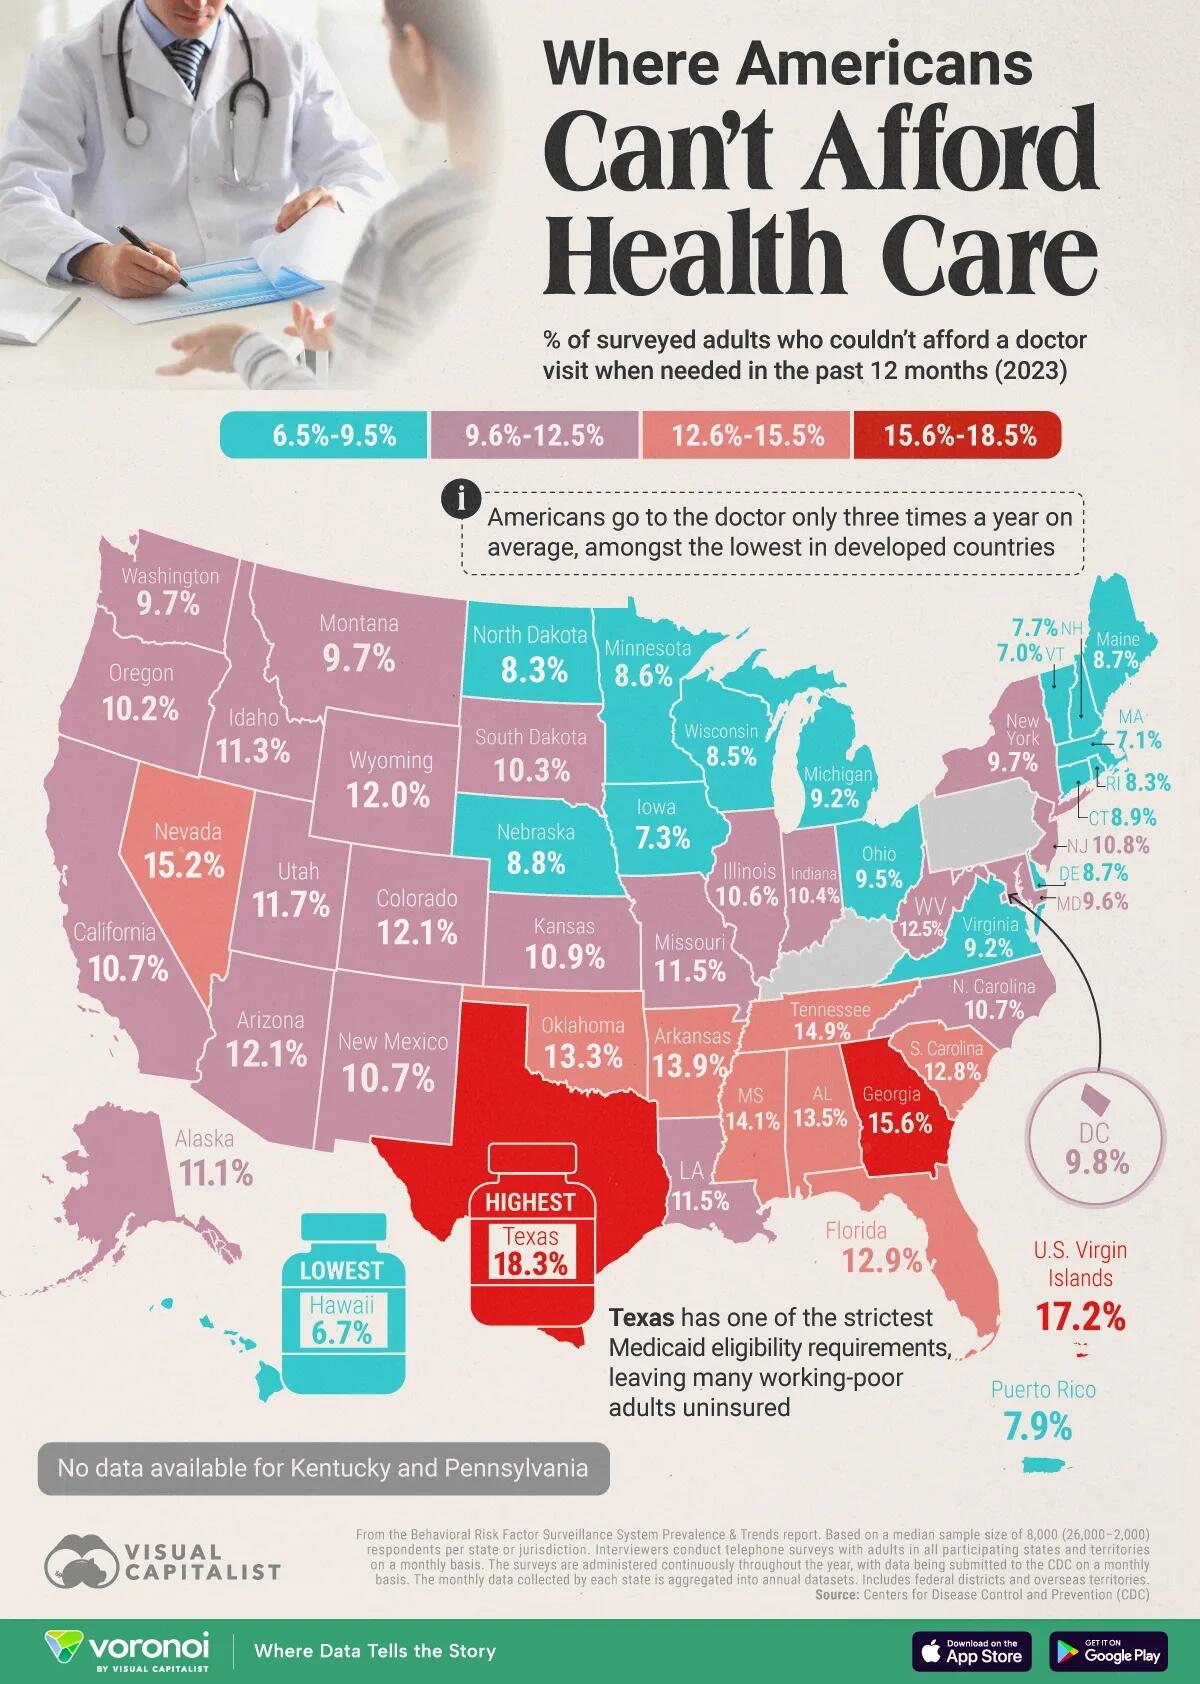
This number comes from Centers for Disease Control and Prevention’s Behavioral Risk Factor Surveillance System (BRFSS) data that lists the share of surveyed adults who skipped seeing a doctor in 2023 because it simply cost too much.
In the map and article below we break down the varying trends per state.
ℹ️ Note: Source figures unavailable for Kentucky and Pennsylvania.
Ranked: States Where Americans Skip the Doctor
Texas leads the nation in not being able to afford healthcare. More than 18% of surveyed adults said skipped a doctor’s visit due to cost, far above the 10.6% U.S. median.
| Year | Top revenue company in the U.S. | Annual revenue of the top company (USD, billions) |
|---|---|---|
| 1955 | General Motors | $9.8 |
| 1956 | General Motors | $12.4 |
| 1957 | General Motors | $10.8 |
| 1958 | General Motors | $11.0 |
| 1959 | General Motors | $9.5 |
| 1960 | General Motors | $11.2 |
| 1961 | General Motors | $12.7 |
| 1962 | General Motors | $11.4 |
| 1963 | General Motors | $14.6 |
| 1964 | General Motors | $16.5 |
| 1965 | General Motors | $17.0 |
| 1966 | General Motors | $20.7 |
| 1967 | General Motors | $20.2 |
| 1968 | General Motors | $20.0 |
| 1969 | General Motors | $22.8 |
| 1970 | General Motors | $24.3 |
| 1971 | General Motors | $18.8 |
| 1972 | General Motors | $28.3 |
| 1973 | General Motors | $30.4 |
| 1974 | General Motors | $35.8 |
| 1975 | Exxon Mobil | $42.1 |
| 1976 | Exxon Mobil | $44.9 |
| 1977 | Exxon Mobil | $48.6 |
| 1978 | General Motors | $55.0 |
| 1979 | General Motors | $63.2 |
| 1980 | Exxon Mobil | $79.1 |
| 1981 | Exxon Mobil | $103.1 |
| 1982 | Exxon Mobil | $108.1 |
| 1983 | Exxon Mobil | $97.2 |
| 1984 | Exxon Mobil | $88.6 |
| 1985 | Exxon Mobil | $90.9 |
| 1986 | General Motors | $96.4 |
| 1987 | General Motors | $102.8 |
| 1988 | General Motors | $101.8 |
| 1989 | General Motors | $121.1 |
| 1990 | General Motors | $127.0 |
| 1991 | General Motors | $125.1 |
| 1992 | General Motors | $123.8 |
| 1993 | General Motors | $132.8 |
| 1994 | General Motors | $133.6 |
| 1995 | General Motors | $155.0 |
| 1996 | General Motors | $168.8 |
| 1997 | General Motors | $168.4 |
| 1998 | General Motors | $178.2 |
| 1999 | General Motors | $161.3 |
| 2000 | General Motors | $189.1 |
| 2001 | Exxon Mobil | $210.4 |
| 2002 | Walmart | $219.8 |
| 2003 | Walmart | $246.5 |
| 2004 | Walmart | $258.7 |
| 2005 | Walmart | $288.2 |
| 2006 | Exxon Mobil | $339.9 |
| 2007 | Walmart | $351.1 |
| 2008 | Walmart | $378.8 |
| 2009 | Exxon Mobil | $442.9 |
| 2010 | Walmart | $408.2 |
| 2011 | Walmart | $421.8 |
| 2012 | Exxon Mobil | $452.9 |
| 2013 | Walmart | $469.2 |
| 2014 | Walmart | $476.3 |
| 2015 | Walmart | $485.7 |
| 2016 | Walmart | $482.1 |
| 2017 | Walmart | $485.9 |
| 2018 | Walmart | $500.3 |
| 2019 | Walmart | $514.4 |
| 2020 | Walmart | $524.0 |
| 2021 | Walmart | $559.2 |
| 2022 | Walmart | $572.8 |
| 2023 | Walmart | $611.3 |
| 2024 | Walmart | $648.1 |
| 2025 | Walmart | $681.0 |
Closely following are the U.S. Virgin Islands (17.2%), Georgia (15.6%), and Nevada (15.2%).
However the map shows a clear clustering of the worst rates.
Eight of the top 10 jurisdictions with the highest cost-related avoidance are in the South. This underlines how lower average incomes and higher uninsured rates compound affordability challenges.
ℹ️ Related: See the most recent data for average incomes by state.
Policymakers in these states have also been slower to expand Medicaid, a factor that researchers link to higher out-of-pocket burdens for residents.
For example, Texas has one of the strictest Medicaid eligibility requirements. Adults under 65 who aren’t disabled or raising a child are ineligible for Medicaid regardless of how low their income is, per Healthinsurance.org.
Even parents can only qualify if their household income is extremely low. This would make it impossible for parents to hold even part-time jobs, as they will lose health coverage if their earnings rise above the threshold.
ℹ️ Related: Texas has a 13% poverty rate, 11th-highest in the country.
Where Fewer Americans Skip the Doctor
At the other end of the spectrum, Hawaii (6.7%), Vermont (7.0%), and Massachusetts (7.1%) report the lowest shares of adults dodging care for financial reasons.
In Massachusetts’ case, a legacy of near-universal coverage dating back to its 2006 healthcare reform was a model for the Affordable Care Act.
Interestingly, high-cost-of-living states like New York and California sit close to the national median, suggesting that robust insurance networks can offset other cost pressures.
ℹ️ Related: Californians and New Yorkers have the lowest purchasing power in the U.S.
With the federal Medicaid continuous-coverage provision now expired, analysts expect affordability gaps to widen unless state safety nets expand.
If you enjoyed today’s post, check out How Often People Go to the Doctor, by Country on Voronoi, the new app from Visual Capitalist.
Tyler Durden
Fri, 10/10/2025 – 22:10ZeroHedge NewsRead More