These Are Europe’s Top Economies By Projected 2026 GDP
After two years of sluggish activity, Europe’s economic engine is forecast to regain traction.
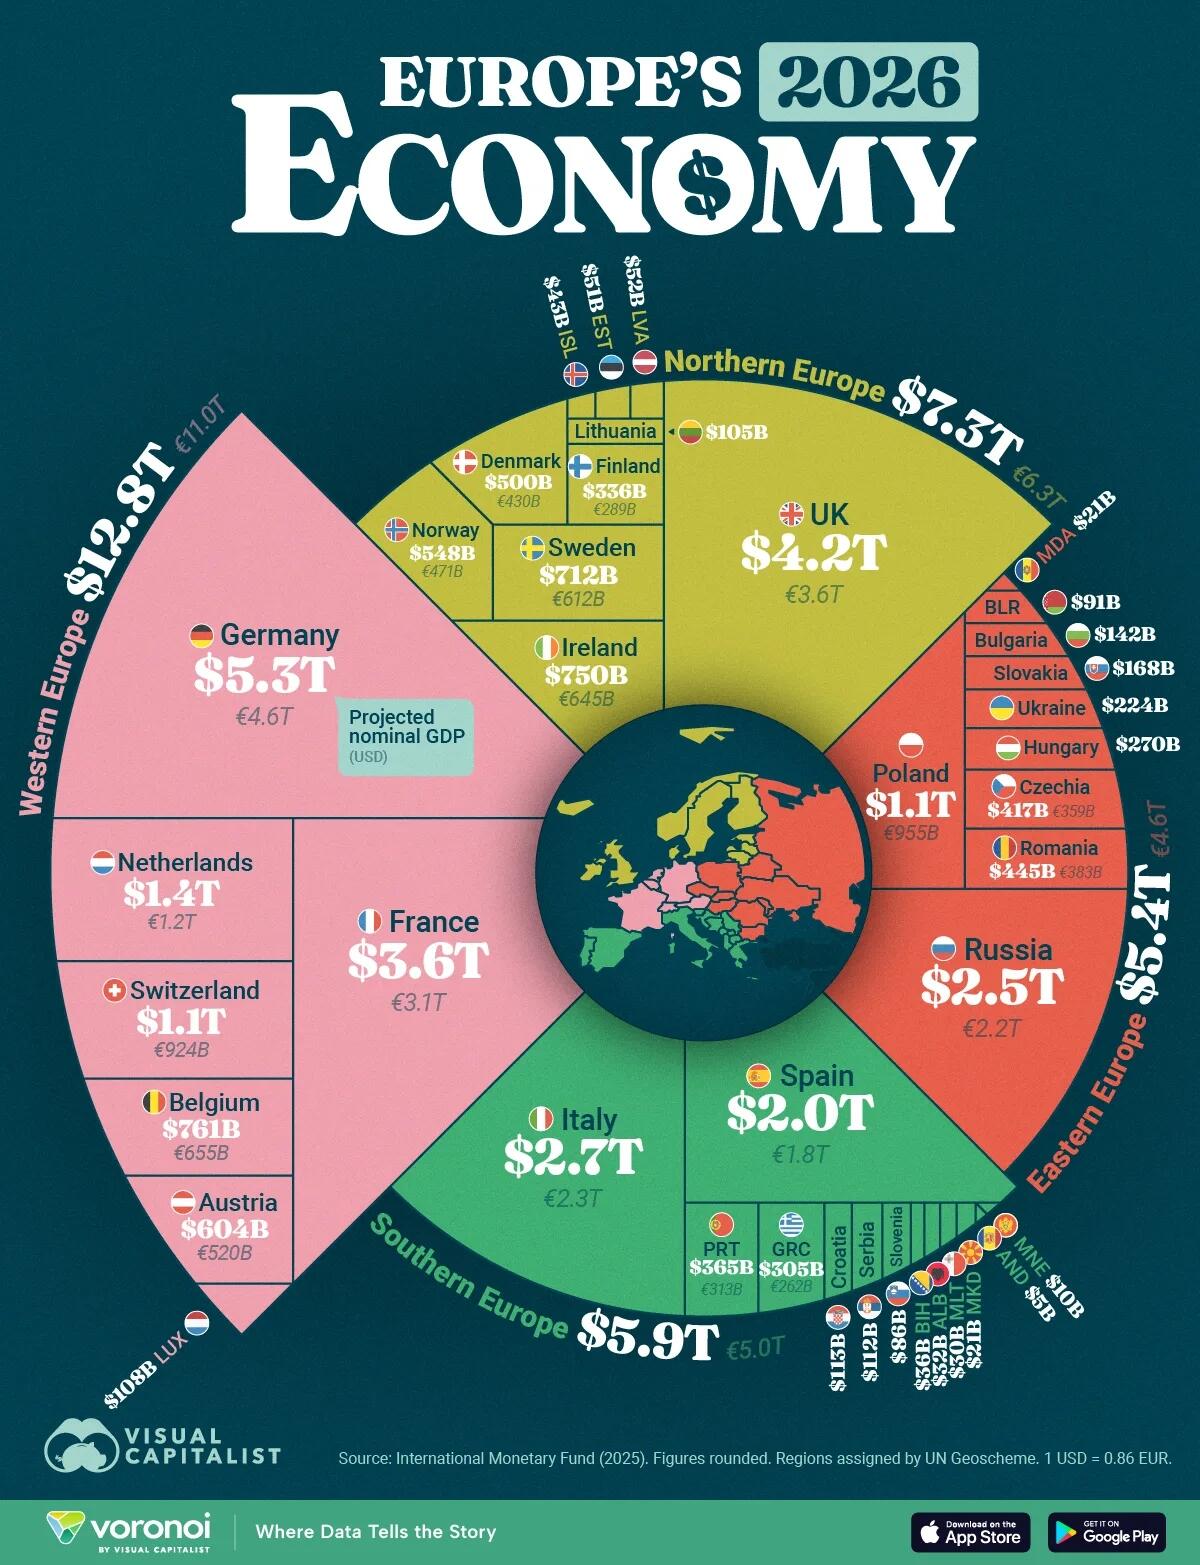
As Visual Capitalist’s Pallavi Rao shows in the chart below, The International Monetary Fund’s (IMF) latest World Economic Outlook projects that the region’s combined output will reach $31.4 trillion (€27.0 trillion) in 2026, with the biggest gains concentrated in Western Europe.
Data for this visualization comes from the IMF’s World Economic Outlook database. It ranks every European country by projected nominal GDP in current U.S. dollars and euros.
Regions are assigned by the UN Geoscheme.
Germany Leads Europe’s Largest Economies
Germany is expected to reclaim momentum, adding almost $400 billion to its economy between 2024 and 2026.
At $5.3 trillion, it will account for roughly 17% of all European GDP.
| Rank | European Country | ISO Code | 2026 GDP (billions USD) |
Readable Label (USD) |
Readable Label (EUR) |
|---|---|---|---|---|---|
| 1 | 🇩🇪 Germany | DEU | $5,328 | $5.3T | €4.6T |
| 2 | 🇬🇧 UK | GBR | $4,226 | $4.2T | €3.6T |
| 3 | 🇫🇷 France | FRA | $3,559 | $3.6T | €3.1T |
| 4 | 🇮🇹 Italy | ITA | $2,702 | $2.7T | €2.3T |
| 5 | 🇷🇺 Russia | RUS | $2,509 | $2.5T | €2.2T |
| 6 | 🇪🇸 Spain | ESP | $2,042 | $2.0T | €1.8T |
| 7 | 🇳🇱 Netherlands | NLD | $1,413 | $1.4T | €1.2T |
| 8 | 🇵🇱 Poland | POL | $1,110 | $1.1T | €955B |
| 9 | 🇨🇭 Switzerland | CHE | $1,075 | $1.1T | €924B |
| 10 | 🇧🇪 Belgium | BEL | $761 | $761B | €655B |
| 11 | 🇮🇪 Ireland | IRL | $750 | $750B | €645B |
| 12 | 🇸🇪 Sweden | SWE | $712 | $712B | €612B |
| 13 | 🇦🇹 Austria | AUT | $604 | $604B | €520B |
| 14 | 🇳🇴 Norway | NOR | $548 | $548B | €471B |
| 15 | 🇩🇰 Denmark | DNK | $500 | $500B | €430B |
| 16 | 🇷🇴 Romania | ROU | $445 | $445B | €383B |
| 17 | 🇨🇿 Czechia | CZE | $417 | $417B | €359B |
| 18 | 🇵🇹 Portugal | PRT | $365 | $365B | €313B |
| 19 | 🇫🇮 Finland | FIN | $336 | $336B | €289B |
| 20 | 🇬🇷 Greece | GRC | $305 | $305B | €262B |
| 21 | 🇭🇺 Hungary | HUN | $270 | $270B | €232B |
| 22 | 🇺🇦 Ukraine | UKR | $224 | $224B | €193B |
| 23 | 🇸🇰 Slovakia | SVK | $168 | $168B | €144B |
| 24 | 🇧🇬 Bulgaria | BGR | $142 | $142B | €122B |
| 25 | 🇭🇷 Croatia | HRV | $113 | $113B | €97B |
| 26 | 🇷🇸 Serbia | SRB | $112 | $112B | €96B |
| 27 | 🇱🇺 Luxembourg | LUX | $108 | $108B | €93B |
| 28 | 🇱🇹 Lithuania | LTU | $105 | $105B | €90B |
| 29 | 🇧🇾 Belarus | BLR | $91 | $91B | €78B |
| 30 | 🇸🇮 Slovenia | SVN | $86 | $86B | €74B |
| 31 | 🇱🇻 Latvia | LVA | $52 | $52B | €45B |
| 32 | 🇪🇪 Estonia | EST | $51 | $51B | €44B |
| 33 | 🇮🇸 Iceland | ISL | $43 | $43B | €37B |
| 34 | 🇧🇦 Bosnia & Herzegovina | BIH | $36 | $36B | €31B |
| 35 | 🇦🇱 Albania | ALB | $32 | $32B | €28B |
| 36 | 🇲🇹 Malta | MLT | $30 | $30B | €26B |
| 37 | 🇲🇩 Moldova | MDA | $21 | $21B | €18B |
| 38 | 🇲🇰 North Macedonia | MKD | $21 | $21B | €18B |
| 39 | 🇲🇪 Montenegro | MNE | $10 | $10B | €9B |
| 40 | 🇦🇩 Andorra | AND | $5 | $5B | €4B |
| 41 | 🇸🇲 San Marino | SMR | $2 | $2B | €2B |
| N/A | 🇪🇺 Western Europe | W EUR | $12,848 | $12.8T | €11.0T |
| N/A | 🇪🇺 Northern Europe | N EUR | $7,322 | $7.3T | €6.3T |
| N/A | 🇪🇺 Southern Europe Europe | S EUR | $5,861 | $5.9T | €5.0T |
| N/A | 🇪🇺 Eastern Europe | E EUR | $5,397 | $5.4T | €4.6T |
| N/A | 🇪🇺 Europe | EUR | $31,427 | $31.4T | €27.0T |
Note: Euro figures from exchange rate conversion. 1 USD = 0.86 EUR
Close behind, the U.K. and France are projected at $4.2 trillion and $3.6 trillion, respectively.
Together, the trio will generate over 40% of Europe’s total economic activity. This underscores how the big markets dominate the regional picture.
ℹ️ Related: In fact, the German economy is as big as the entire Eastern European economy ($5.4T).
Southern and Eastern Europe Show Diverging Paths
The continent can effectively be divided into two halves: the Northern and Western half and the Southern and Eastern half.
Italy and Spain, Southern Europe’s heavyweights, are on course for modest expansion, at $2.7 trillion and $1.8 trillion in 2026.
| Rank | European Region | 2026 GDP (billions USD) |
Readable Label (USD) |
Readable Label (EUR) |
|---|---|---|---|---|
| 1 | 🇪🇺 Western Europe | $12,848 | $12.8T | €11.0T |
| 2 | 🇪🇺 Northern Europe | $7,322 | $7.3T | €6.3T |
| 3 | 🇪🇺 Southern Europe Europe | $5,861 | $5.9T | €5.0T |
| 4 | 🇪🇺 Eastern Europe | $5,397 | $5.4T | €4.6T |
| N/A | 🇪🇺 Europe | $31,427 | $31.4T | €27.0T |
In Eastern Europe, Russia is projected at $2.5 trillion, aided by energy exports, while Poland breaks into the continental top 10 at $1.1 trillion.
However, despite a decade of super-charged growth that has lifted real GDP per capita in the East, there’s still a ways to go to close the income gap with the West.
ℹ️ Related: Take a look at where living standards have grown the most in Europe in the last decade.
Europe’s Economic Outlook for 2026
The IMF has good and bad news for Europe.
The good news is that the pandemic and energy shocks have passed and the continent is officially in recovery mode thanks to “good policy decisions.”
This had led to higher real wages that have boosted consumption, particularly in Germany, the largest economy.
The bad news is that Donald Trump’s trade war is causing uncertainty and will shave off 0.5% of growth, which will be somewhat offset by higher infrastructure and defense spending.
However, in turn this higher government spending is coming at the expense of debt.
How does Europe’s economy look when accounting for local prices? Check out Breaking Down Europe’s Economy, Adjusted for Living Costs on Voronoi, the new app from Visual Capitalist.
Tyler Durden
Thu, 11/06/2025 – 02:45ZeroHedge NewsRead More