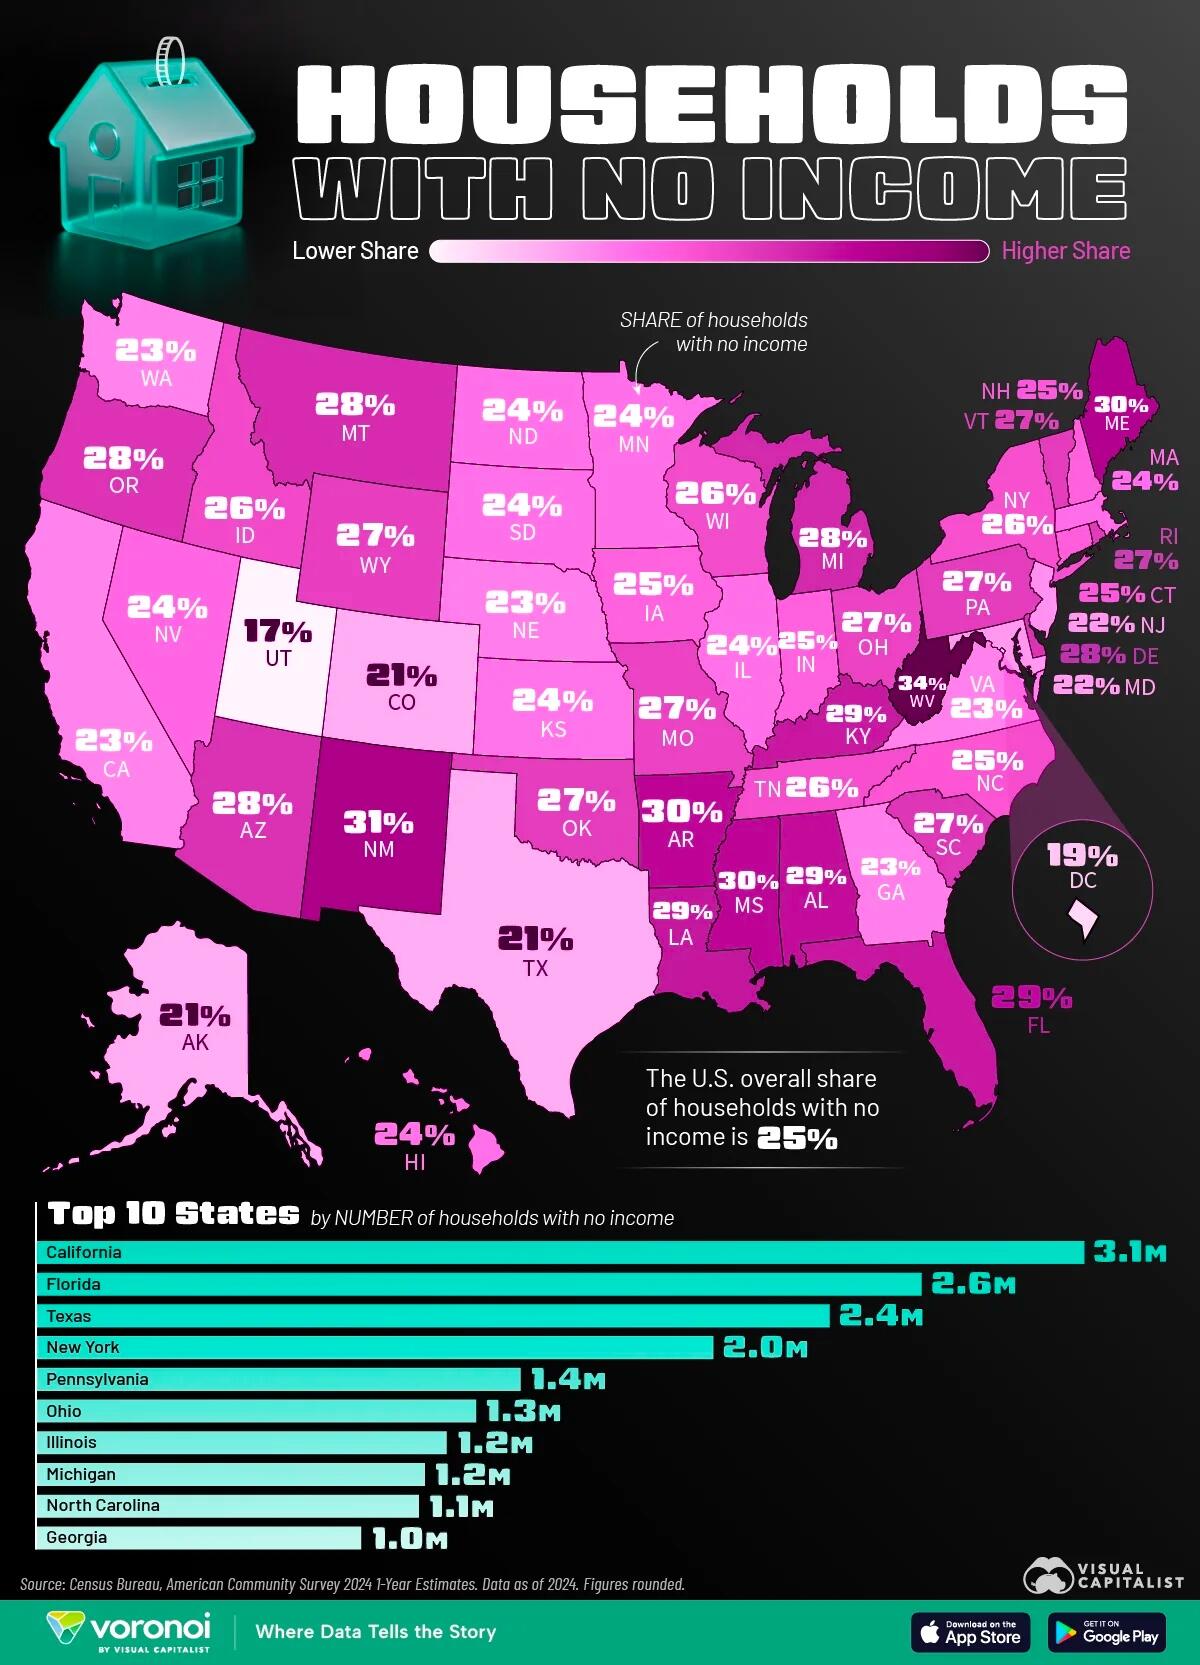
West Virginia Has The Highest Share Of Income-less Households
Household income is often discussed in terms of averages, but the share of households reporting no income can reveal a different side of the country’s economic reality.
This map, via Visual Capitalist’s Niccolo Conte, highlights the share of households with no income across U.S. states (and the District of Columbia) in 2024 using data from the Census Bureau, American Community Survey 2024 1-Year Estimates.
States with the Highest Shares of No-Income Households
Across U.S. states, the share of households with no income ranges from a low of 17% (Utah) to a high of 34% (West Virginia). The United States’ overall share of no-income households is 25%.
The data table below lists each state’s share of households with no income:
| State | Share of households with no income |
|---|---|
| West Virginia | 34% |
| New Mexico | 31% |
| Maine | 30% |
| Arkansas | 30% |
| Mississippi | 30% |
| Alabama | 29% |
| Louisiana | 29% |
| Florida | 29% |
| Kentucky | 29% |
| Michigan | 28% |
| Montana | 28% |
| Delaware | 28% |
| Arizona | 28% |
| Oregon | 28% |
| Vermont | 27% |
| South Carolina | 27% |
| Rhode Island | 27% |
| Oklahoma | 27% |
| Pennsylvania | 27% |
| Wyoming | 27% |
| Ohio | 27% |
| Missouri | 27% |
| Idaho | 26% |
| Wisconsin | 26% |
| Tennessee | 26% |
| New York | 26% |
| North Carolina | 25% |
| U.S. Overall | 25% |
| Connecticut | 25% |
| Indiana | 25% |
| Iowa | 25% |
| New Hampshire | 25% |
| Hawaii | 24% |
| Nevada | 24% |
| South Dakota | 24% |
| Illinois | 24% |
| Minnesota | 24% |
| Massachusetts | 24% |
| Kansas | 24% |
| North Dakota | 24% |
| Washington | 23% |
| Georgia | 23% |
| Nebraska | 23% |
| Virginia | 23% |
| California | 23% |
| New Jersey | 22% |
| Maryland | 22% |
| Alaska | 21% |
| Colorado | 21% |
| Texas | 21% |
| District of Columbia | 19% |
| Utah | 17% |
West Virginia stands out with the highest share of households reporting no income at 34%, three percentage points ahead of New Mexico at 31%.
The top five states by share of no-income households are rounded out with Maine, Arkansas, and Mississippi each at 30%.
These states tend to have older populations, higher rates of disability, and lower median incomes overall. In such contexts, a larger portion of households rely on non-earned income sources or report no income during the survey period.
States with the Fewest No-Income Households
Even among the lowest results, “no income” households remain a meaningful slice of the population.
After Utah (17%), the District of Columbia is next-lowest at 19%. Alaska, Colorado, and Texas each come in at 21%, with only five jurisdictions at 21% or lower.
Utah’s low share of one-adult/non-family households is a large driver of its low rate of households with no income.
States with the Most No-Income Households
Below we look at the top 10 states by number of households with no income:
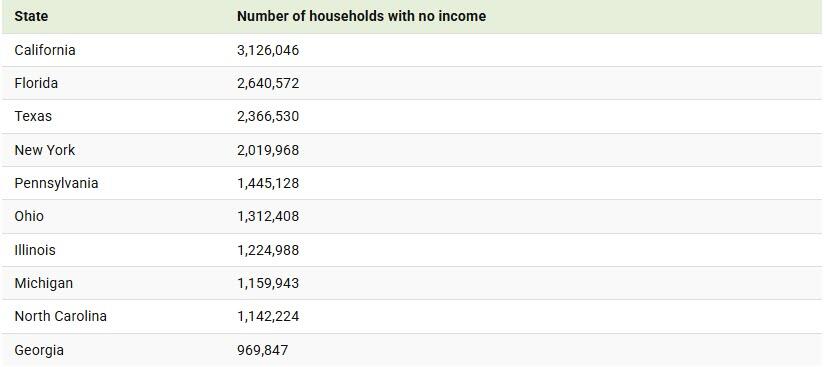
Beyond California, Texas, Florida, and New York, states like Ohio and Michigan also rank in the top 10, despite sitting closer to the middle of the pack by share of no-income households. Their high totals reflect population scale rather than unusually high prevalence.
Meanwhile, states with the highest shares—such as West Virginia and New Mexico—do not appear in the top 10 by total households, highlighting the gap between where no-income households are most concentrated versus where they are most numerous.
To learn more about the incomes across the U.S., check out this graphic about the income needed to reach the 1% in each state on Voronoi.
Tyler Durden
Mon, 12/29/2025 – 18:00ZeroHedge NewsRead More